前回エイムズの住宅価格データセットの分析計画を練りました。
今回はデータ俯瞰パートに入りたいと思います。
エイムズの住宅価格のデータセットのダウンロード
# amesのデータセットをダウンロード
my-venv/bin/kaggle competitions download -c house-prices-advanced-regression-techniqueskaggleコマンドでダウンロードします。(KaggleのDataセクションから直接zipファイルをダウンロードしてもOKです。)
kaggleコマンドのインストールのやり方はこちらの記事にまとめています。
# amesフォルダに解凍
unzip house-prices-advanced-regression-techniques.zip -d amesArchive: house-prices-advanced-regression-techniques.zip inflating: ames/data_description.txt inflating: ames/sample_submission.csv inflating: ames/test.csv inflating: ames/train.csv
データの読み込み
import pandas as pd
# エイムズの住宅価格のデータセットの訓練データとテストデータを読み込み
df = pd.read_csv("/Users/hinomaruc/Desktop/blog/dataset/ames/train.csv")
df_test = pd.read_csv("/Users/hinomaruc/Desktop/blog/dataset/ames/test.csv")
テストデータも少しだけ確認したいので読み込んでいます。
infoメソッドで俯瞰 (訓練データ)
# レコード件数、カラム数、欠損値の存在、データ型の確認
df.info()
    RangeIndex: 1460 entries, 0 to 1459
    Data columns (total 81 columns):
     #   Column         Non-Null Count  Dtype
    ---  ------         --------------  -----
     0   Id             1460 non-null   int64
     1   MSSubClass     1460 non-null   int64
     2   MSZoning       1460 non-null   object
     3   LotFrontage    1201 non-null   float64
     4   LotArea        1460 non-null   int64
     5   Street         1460 non-null   object
     6   Alley          91 non-null     object
     7   LotShape       1460 non-null   object
     8   LandContour    1460 non-null   object
     9   Utilities      1460 non-null   object
     10  LotConfig      1460 non-null   object
     11  LandSlope      1460 non-null   object
     12  Neighborhood   1460 non-null   object
     13  Condition1     1460 non-null   object
     14  Condition2     1460 non-null   object
     15  BldgType       1460 non-null   object
     16  HouseStyle     1460 non-null   object
     17  OverallQual    1460 non-null   int64
     18  OverallCond    1460 non-null   int64
     19  YearBuilt      1460 non-null   int64
     20  YearRemodAdd   1460 non-null   int64
     21  RoofStyle      1460 non-null   object
     22  RoofMatl       1460 non-null   object
     23  Exterior1st    1460 non-null   object
     24  Exterior2nd    1460 non-null   object
     25  MasVnrType     1452 non-null   object
     26  MasVnrArea     1452 non-null   float64
     27  ExterQual      1460 non-null   object
     28  ExterCond      1460 non-null   object
     29  Foundation     1460 non-null   object
     30  BsmtQual       1423 non-null   object
     31  BsmtCond       1423 non-null   object
     32  BsmtExposure   1422 non-null   object
     33  BsmtFinType1   1423 non-null   object
     34  BsmtFinSF1     1460 non-null   int64
     35  BsmtFinType2   1422 non-null   object
     36  BsmtFinSF2     1460 non-null   int64
     37  BsmtUnfSF      1460 non-null   int64
     38  TotalBsmtSF    1460 non-null   int64
     39  Heating        1460 non-null   object
     40  HeatingQC      1460 non-null   object
     41  CentralAir     1460 non-null   object
     42  Electrical     1459 non-null   object
     43  1stFlrSF       1460 non-null   int64
     44  2ndFlrSF       1460 non-null   int64
     45  LowQualFinSF   1460 non-null   int64
     46  GrLivArea      1460 non-null   int64
     47  BsmtFullBath   1460 non-null   int64
     48  BsmtHalfBath   1460 non-null   int64
     49  FullBath       1460 non-null   int64
     50  HalfBath       1460 non-null   int64
     51  BedroomAbvGr   1460 non-null   int64
     52  KitchenAbvGr   1460 non-null   int64
     53  KitchenQual    1460 non-null   object
     54  TotRmsAbvGrd   1460 non-null   int64
     55  Functional     1460 non-null   object
     56  Fireplaces     1460 non-null   int64
     57  FireplaceQu    770 non-null    object
     58  GarageType     1379 non-null   object
     59  GarageYrBlt    1379 non-null   float64
     60  GarageFinish   1379 non-null   object
     61  GarageCars     1460 non-null   int64
     62  GarageArea     1460 non-null   int64
     63  GarageQual     1379 non-null   object
     64  GarageCond     1379 non-null   object
     65  PavedDrive     1460 non-null   object
     66  WoodDeckSF     1460 non-null   int64
     67  OpenPorchSF    1460 non-null   int64
     68  EnclosedPorch  1460 non-null   int64
     69  3SsnPorch      1460 non-null   int64
     70  ScreenPorch    1460 non-null   int64
     71  PoolArea       1460 non-null   int64
     72  PoolQC         7 non-null      object
     73  Fence          281 non-null    object
     74  MiscFeature    54 non-null     object
     75  MiscVal        1460 non-null   int64
     76  MoSold         1460 non-null   int64
     77  YrSold         1460 non-null   int64
     78  SaleType       1460 non-null   object
     79  SaleCondition  1460 non-null   object
     80  SalePrice      1460 non-null   int64
    dtypes: float64(3), int64(35), object(43)
    memory usage: 924.0+ KB
・MSSubClassがint型になっているようです。
・Alley、FireplaceQu、PoolQC、Fence、MiscFeatureなどはかなりNULLが多そうです。
データ型の確認 (テストデータ)
# レコード件数、カラム数、欠損値の存在、データ型の確認
df_test.info()
    RangeIndex: 1459 entries, 0 to 1458
    Data columns (total 80 columns):
     #   Column         Non-Null Count  Dtype
    ---  ------         --------------  -----
     0   Id             1459 non-null   int64
     1   MSSubClass     1459 non-null   int64
     2   MSZoning       1455 non-null   object
     3   LotFrontage    1232 non-null   float64
     4   LotArea        1459 non-null   int64
     5   Street         1459 non-null   object
     6   Alley          107 non-null    object
     7   LotShape       1459 non-null   object
     8   LandContour    1459 non-null   object
     9   Utilities      1457 non-null   object
     10  LotConfig      1459 non-null   object
     11  LandSlope      1459 non-null   object
     12  Neighborhood   1459 non-null   object
     13  Condition1     1459 non-null   object
     14  Condition2     1459 non-null   object
     15  BldgType       1459 non-null   object
     16  HouseStyle     1459 non-null   object
     17  OverallQual    1459 non-null   int64
     18  OverallCond    1459 non-null   int64
     19  YearBuilt      1459 non-null   int64
     20  YearRemodAdd   1459 non-null   int64
     21  RoofStyle      1459 non-null   object
     22  RoofMatl       1459 non-null   object
     23  Exterior1st    1458 non-null   object
     24  Exterior2nd    1458 non-null   object
     25  MasVnrType     1443 non-null   object
     26  MasVnrArea     1444 non-null   float64
     27  ExterQual      1459 non-null   object
     28  ExterCond      1459 non-null   object
     29  Foundation     1459 non-null   object
     30  BsmtQual       1415 non-null   object
     31  BsmtCond       1414 non-null   object
     32  BsmtExposure   1415 non-null   object
     33  BsmtFinType1   1417 non-null   object
     34  BsmtFinSF1     1458 non-null   float64
     35  BsmtFinType2   1417 non-null   object
     36  BsmtFinSF2     1458 non-null   float64
     37  BsmtUnfSF      1458 non-null   float64
     38  TotalBsmtSF    1458 non-null   float64
     39  Heating        1459 non-null   object
     40  HeatingQC      1459 non-null   object
     41  CentralAir     1459 non-null   object
     42  Electrical     1459 non-null   object
     43  1stFlrSF       1459 non-null   int64
     44  2ndFlrSF       1459 non-null   int64
     45  LowQualFinSF   1459 non-null   int64
     46  GrLivArea      1459 non-null   int64
     47  BsmtFullBath   1457 non-null   float64
     48  BsmtHalfBath   1457 non-null   float64
     49  FullBath       1459 non-null   int64
     50  HalfBath       1459 non-null   int64
     51  BedroomAbvGr   1459 non-null   int64
     52  KitchenAbvGr   1459 non-null   int64
     53  KitchenQual    1458 non-null   object
     54  TotRmsAbvGrd   1459 non-null   int64
     55  Functional     1457 non-null   object
     56  Fireplaces     1459 non-null   int64
     57  FireplaceQu    729 non-null    object
     58  GarageType     1383 non-null   object
     59  GarageYrBlt    1381 non-null   float64
     60  GarageFinish   1381 non-null   object
     61  GarageCars     1458 non-null   float64
     62  GarageArea     1458 non-null   float64
     63  GarageQual     1381 non-null   object
     64  GarageCond     1381 non-null   object
     65  PavedDrive     1459 non-null   object
     66  WoodDeckSF     1459 non-null   int64
     67  OpenPorchSF    1459 non-null   int64
     68  EnclosedPorch  1459 non-null   int64
     69  3SsnPorch      1459 non-null   int64
     70  ScreenPorch    1459 non-null   int64
     71  PoolArea       1459 non-null   int64
     72  PoolQC         3 non-null      object
     73  Fence          290 non-null    object
     74  MiscFeature    51 non-null     object
     75  MiscVal        1459 non-null   int64
     76  MoSold         1459 non-null   int64
     77  YrSold         1459 non-null   int64
     78  SaleType       1458 non-null   object
     79  SaleCondition  1459 non-null   object
    dtypes: float64(11), int64(26), object(43)
    memory usage: 912.0+ KB
訓練データと同じです。当然ながら目的変数であるSalePrice変数はテストデータには存在しません。
データ型の変換
pandasは自動でデータ型を推定してくれますが、一部想定していないデータ型が選択される場合があります。
今回、MSSubClassはint64になっています。データの説明を見ると数値型の区分値になっているようです。
数字の大小に意味があればint64のままでもいいですが、個人的にはあまり関係なさそうに思えるのでデータを明示的に文字列に変更しようと思います。
MSSubClass: Identifies the type of dwelling involved in the sale.
20 1-STORY 1946 & NEWER ALL STYLES
30 1-STORY 1945 & OLDER
40 1-STORY W/FINISHED ATTIC ALL AGES
45 1-1/2 STORY - UNFINISHED ALL AGES
50 1-1/2 STORY FINISHED ALL AGES
60 2-STORY 1946 & NEWER
70 2-STORY 1945 & OLDER
75 2-1/2 STORY ALL AGES
80 SPLIT OR MULTI-LEVEL
85 SPLIT FOYER
90 DUPLEX - ALL STYLES AND AGES
120 1-STORY PUD (Planned Unit Development) - 1946 & NEWER
150 1-1/2 STORY PUD - ALL AGES
160 2-STORY PUD - 1946 & NEWER
180 PUD - MULTILEVEL - INCL SPLIT LEV/FOYER
190 2 FAMILY CONVERSION - ALL STYLES AND AGES
# データ型を変更する。read_csvの時にやってもOK
df = df.astype({'MSSubClass': str})
df_test = df_test.astype({'MSSubClass': str})
これでMSSubClassは文字区分として認識されます。
各カラムの欠損割合を確認 (訓練データ)
infoメソッドで確認済みですが、欠損割合を算出してみます。
# 欠損値割合の確認
chk_null = df.isnull().sum()
chk_null_pct = chk_null / (df.index.max() + 1)
chk_null_tbl = pd.concat([chk_null[chk_null > 0], chk_null_pct[chk_null_pct > 0]], axis=1)
chk_null_tbl.sort_values(by=1,ascending=False).rename(columns={0: "欠損レコード数",1: "欠損割合(missing rows / all rows)"})
欠損レコード数 欠損割合(missing rows / all rows) PoolQC 1453 0.995205 MiscFeature 1406 0.963014 Alley 1369 0.937671 Fence 1179 0.807534 FireplaceQu 690 0.472603 LotFrontage 259 0.177397 GarageType 81 0.055479 GarageYrBlt 81 0.055479 GarageFinish 81 0.055479 GarageQual 81 0.055479 GarageCond 81 0.055479 BsmtExposure 38 0.026027 BsmtFinType2 38 0.026027 BsmtFinType1 37 0.025342 BsmtCond 37 0.025342 BsmtQual 37 0.025342 MasVnrArea 8 0.005479 MasVnrType 8 0.005479 Electrical 1 0.000685
可能な限り欠損値処理をしてあげたいところです。
PoolQCは99%欠損しているので使えるかどうか。。
各カラムの欠損割合を確認 (テストデータ)
# 欠損値割合の確認
chk_null = df_test.isnull().sum()
chk_null_pct = chk_null / (df_test.index.max() + 1)
chk_null_tbl = pd.concat([chk_null[chk_null > 0], chk_null_pct[chk_null_pct > 0]], axis=1)
chk_null_tbl.sort_values(by=1,ascending=False).rename(columns={0: "欠損レコード数",1: "欠損割合(missing rows / all rows)"})
欠損レコード数 欠損割合(missing rows / all rows) PoolQC 1456 0.997944 MiscFeature 1408 0.965045 Alley 1352 0.926662 Fence 1169 0.801234 FireplaceQu 730 0.500343 LotFrontage 227 0.155586 GarageCond 78 0.053461 GarageYrBlt 78 0.053461 GarageQual 78 0.053461 GarageFinish 78 0.053461 GarageType 76 0.052090 BsmtCond 45 0.030843 BsmtExposure 44 0.030158 BsmtQual 44 0.030158 BsmtFinType1 42 0.028787 BsmtFinType2 42 0.028787 MasVnrType 16 0.010966 MasVnrArea 15 0.010281 MSZoning 4 0.002742 BsmtFullBath 2 0.001371 BsmtHalfBath 2 0.001371 Functional 2 0.001371 Utilities 2 0.001371 GarageCars 1 0.000685 GarageArea 1 0.000685 TotalBsmtSF 1 0.000685 KitchenQual 1 0.000685 BsmtUnfSF 1 0.000685 BsmtFinSF2 1 0.000685 BsmtFinSF1 1 0.000685 Exterior2nd 1 0.000685 Exterior1st 1 0.000685 SaleType 1 0.000685
訓練データと似たような感じです。
記述統計量を確認 (数値型)
# 記述統計量を確認(カラム数が多いので縦持ちに変換)
df.describe(percentiles=[0.1,0.2,0.3,0.4,0.5,0.6,0.7,0.8,0.9,0.95,0.99]).transpose()
パーセンタイルの情報は詳細を含めました。通常オプションで指定しなければ四分位までしか出力してくれません。
欠損がなくても全部0になっている変数とかあればパーセンタイルを確認すれば分かります。異常値とかも99パーセンタイルと最大値を見れば分かると思います。
count mean std min 10% 20% 30% 40% 50% 60% 70% 80% 90% 95% 99% max Id 1460.0 730.500000 421.610009 1.0 146.9 292.8 438.7 584.6 730.5 876.4 1022.3 1168.2 1314.1 1387.05 1445.41 1460.0 LotFrontage 1201.0 70.049958 24.284752 21.0 44.0 53.0 60.0 63.0 69.0 74.0 79.0 85.0 96.0 107.00 141.00 313.0 LotArea 1460.0 10516.828082 9981.264932 1300.0 5000.0 7078.4 8063.7 8793.4 9478.5 10198.2 11066.5 12205.8 14381.7 17401.15 37567.64 215245.0 OverallQual 1460.0 6.099315 1.382997 1.0 5.0 5.0 5.0 6.0 6.0 6.0 7.0 7.0 8.0 8.00 10.00 10.0 OverallCond 1460.0 5.575342 1.112799 1.0 5.0 5.0 5.0 5.0 5.0 5.0 6.0 7.0 7.0 8.00 9.00 9.0 YearBuilt 1460.0 1971.267808 30.202904 1872.0 1924.9 1947.8 1958.0 1965.0 1973.0 1984.0 1997.3 2003.0 2006.0 2007.00 2009.00 2010.0 YearRemodAdd 1460.0 1984.865753 20.645407 1950.0 1950.0 1961.8 1971.0 1980.0 1994.0 1998.0 2002.0 2005.0 2006.0 2007.00 2009.00 2010.0 MasVnrArea 1452.0 103.685262 181.066207 0.0 0.0 0.0 0.0 0.0 0.0 16.0 117.0 206.0 335.0 456.00 791.92 1600.0 BsmtFinSF1 1460.0 443.639726 456.098091 0.0 0.0 0.0 0.0 218.6 383.5 525.6 655.0 806.4 1065.5 1274.00 1572.41 5644.0 BsmtFinSF2 1460.0 46.549315 161.319273 0.0 0.0 0.0 0.0 0.0 0.0 0.0 0.0 0.0 117.2 396.20 830.38 1474.0 BsmtUnfSF 1460.0 567.240411 441.866955 0.0 74.9 172.0 280.0 374.6 477.5 604.4 736.0 896.0 1232.0 1468.00 1797.05 2336.0 TotalBsmtSF 1460.0 1057.429452 438.705324 0.0 636.9 755.8 840.0 910.0 991.5 1088.0 1216.0 1391.2 1602.2 1753.00 2155.05 6110.0 1stFlrSF 1460.0 1162.626712 386.587738 334.0 756.9 848.0 915.7 1000.2 1087.0 1182.0 1314.0 1482.4 1680.0 1831.25 2219.46 4692.0 2ndFlrSF 1460.0 346.992466 436.528436 0.0 0.0 0.0 0.0 0.0 0.0 455.4 672.0 796.2 954.2 1141.05 1418.92 2065.0 LowQualFinSF 1460.0 5.844521 48.623081 0.0 0.0 0.0 0.0 0.0 0.0 0.0 0.0 0.0 0.0 0.00 360.00 572.0 GrLivArea 1460.0 1515.463699 525.480383 334.0 912.0 1066.6 1208.0 1339.0 1464.0 1578.0 1709.3 1869.0 2158.3 2466.10 3123.48 5642.0 BsmtFullBath 1460.0 0.425342 0.518911 0.0 0.0 0.0 0.0 0.0 0.0 1.0 1.0 1.0 1.0 1.00 2.00 3.0 BsmtHalfBath 1460.0 0.057534 0.238753 0.0 0.0 0.0 0.0 0.0 0.0 0.0 0.0 0.0 0.0 1.00 1.00 2.0 FullBath 1460.0 1.565068 0.550916 0.0 1.0 1.0 1.0 1.0 2.0 2.0 2.0 2.0 2.0 2.00 3.00 3.0 HalfBath 1460.0 0.382877 0.502885 0.0 0.0 0.0 0.0 0.0 0.0 0.0 1.0 1.0 1.0 1.00 1.00 2.0 BedroomAbvGr 1460.0 2.866438 0.815778 0.0 2.0 2.0 3.0 3.0 3.0 3.0 3.0 3.0 4.0 4.00 5.00 8.0 KitchenAbvGr 1460.0 1.046575 0.220338 0.0 1.0 1.0 1.0 1.0 1.0 1.0 1.0 1.0 1.0 1.00 2.00 3.0 TotRmsAbvGrd 1460.0 6.517808 1.625393 2.0 5.0 5.0 6.0 6.0 6.0 7.0 7.0 8.0 9.0 10.00 11.00 14.0 Fireplaces 1460.0 0.613014 0.644666 0.0 0.0 0.0 0.0 0.0 1.0 1.0 1.0 1.0 1.0 2.00 2.00 3.0 GarageYrBlt 1379.0 1978.506164 24.689725 1900.0 1945.0 1957.0 1965.0 1973.0 1980.0 1993.0 1999.0 2004.0 2006.0 2007.00 2009.00 2010.0 GarageCars 1460.0 1.767123 0.747315 0.0 1.0 1.0 1.0 2.0 2.0 2.0 2.0 2.0 3.0 3.00 3.00 4.0 GarageArea 1460.0 472.980137 213.804841 0.0 240.0 295.6 384.0 440.0 480.0 516.0 560.0 620.2 757.1 850.10 1002.79 1418.0 WoodDeckSF 1460.0 94.244521 125.338794 0.0 0.0 0.0 0.0 0.0 0.0 100.0 144.0 192.0 262.0 335.00 505.46 857.0 OpenPorchSF 1460.0 46.660274 66.256028 0.0 0.0 0.0 0.0 0.0 25.0 40.0 57.0 83.2 130.0 175.05 285.82 547.0 EnclosedPorch 1460.0 21.954110 61.119149 0.0 0.0 0.0 0.0 0.0 0.0 0.0 0.0 0.0 112.0 180.15 261.05 552.0 3SsnPorch 1460.0 3.409589 29.317331 0.0 0.0 0.0 0.0 0.0 0.0 0.0 0.0 0.0 0.0 0.00 168.00 508.0 ScreenPorch 1460.0 15.060959 55.757415 0.0 0.0 0.0 0.0 0.0 0.0 0.0 0.0 0.0 0.0 160.00 268.05 480.0 PoolArea 1460.0 2.758904 40.177307 0.0 0.0 0.0 0.0 0.0 0.0 0.0 0.0 0.0 0.0 0.00 0.00 738.0 MiscVal 1460.0 43.489041 496.123024 0.0 0.0 0.0 0.0 0.0 0.0 0.0 0.0 0.0 0.0 0.00 700.00 15500.0 MoSold 1460.0 6.321918 2.703626 1.0 3.0 4.0 5.0 6.0 6.0 7.0 7.0 8.0 10.0 11.00 12.00 12.0 YrSold 1460.0 2007.815753 1.328095 2006.0 2006.0 2006.0 2007.0 2007.0 2008.0 2008.0 2009.0 2009.0 2010.0 2010.00 2010.00 2010.0 SalePrice 1460.0 180921.195890 79442.502883 34900.0 106475.0 124000.0 135500.0 147000.0 163000.0 179280.0 198620.0 230000.0 278000.0 326100.00 442567.01 755000.0
LowQualFinSF、BsmtHalfBath、3SsnPorch、PoolArea、MiscValなどの変数は大半が0で占められているようです。
記述統計量を確認 (名義型)
レコード数(count )、ユニーク数(count distinct )、最頻値、最頻値の出現数を確認しようと思います。
# 名義型の変数の統計量を確認。
df.describe(include=['O']).transpose()
count unique top freq MSSubClass 1460 15 20 536 MSZoning 1460 5 RL 1151 Street 1460 2 Pave 1454 Alley 91 2 Grvl 50 LotShape 1460 4 Reg 925 LandContour 1460 4 Lvl 1311 Utilities 1460 2 AllPub 1459 LotConfig 1460 5 Inside 1052 LandSlope 1460 3 Gtl 1382 Neighborhood 1460 25 NAmes 225 Condition1 1460 9 Norm 1260 Condition2 1460 8 Norm 1445 BldgType 1460 5 1Fam 1220 HouseStyle 1460 8 1Story 726 RoofStyle 1460 6 Gable 1141 RoofMatl 1460 8 CompShg 1434 Exterior1st 1460 15 VinylSd 515 Exterior2nd 1460 16 VinylSd 504 MasVnrType 1452 4 None 864 ExterQual 1460 4 TA 906 ExterCond 1460 5 TA 1282 Foundation 1460 6 PConc 647 BsmtQual 1423 4 TA 649 BsmtCond 1423 4 TA 1311 BsmtExposure 1422 4 No 953 BsmtFinType1 1423 6 Unf 430 BsmtFinType2 1422 6 Unf 1256 Heating 1460 6 GasA 1428 HeatingQC 1460 5 Ex 741 CentralAir 1460 2 Y 1365 Electrical 1459 5 SBrkr 1334 KitchenQual 1460 4 TA 735 Functional 1460 7 Typ 1360 FireplaceQu 770 5 Gd 380 GarageType 1379 6 Attchd 870 GarageFinish 1379 3 Unf 605 GarageQual 1379 5 TA 1311 GarageCond 1379 5 TA 1326 PavedDrive 1460 3 Y 1340 PoolQC 7 3 Gd 3 Fence 281 4 MnPrv 157 MiscFeature 54 4 Shed 49 SaleType 1460 9 WD 1267 SaleCondition 1460 6 Normal 1198
Utilitiesはほとんどが同じ区分(AllPub)で占められているようです。このような変数は予測モデルには使えないですね。。
freqが1400以上の変数(Street、Condition2、Heatingなど)はほとんど意味がなさそうです。
各変数の分布をグラフで視覚的に確認
視覚化した方が分かりやすいという方はグラフで確認することをおすすめします。
数値や文字で把握するのが分かりやすい人とグラフで視覚的に把握するのが得意な人がいるかと思います。
今までの経験上、だいたい視覚化した方が分かりやすいという方が多かったかなという印象です。(8~9割くらい?)
import seaborn as sns
# 描画設定
sns.set_style("whitegrid")
from matplotlib import rcParams
rcParams['font.family'] = 'Hiragino Sans' # Macの場合
#rcParams['font.family'] = 'Meiryo' # Windowsの場合
#rcParams['font.family'] = 'VL PGothic' # Linuxの場合
rcParams['xtick.labelsize'] = 12       # x軸のラベルのフォントサイズ
rcParams['ytick.labelsize'] = 12       # y軸のラベルのフォントサイズ
rcParams['axes.labelsize'] = 18        # ラベルのフォントとサイズ
rcParams['figure.figsize'] = 18,8      # 画像サイズの変更(inch)
# 数値型変数と名義型変数それぞれに限定したデータフレームを作成
import matplotlib.pyplot as plt
numerical_df = df.select_dtypes(exclude=['object']).copy()
obj_df = df.select_dtypes(include=['object']).copy()目的変数(SalePrice)の分布を確認
エイムズの住宅価格の分布を確認します。目的変数となる重要な変数なので単独で確認します。
色分けは2種類試しています。
SaleCondition(販売条件)はグラフとして分かりやすそうだったのと、MSSubClassは何となく傾向がでるかな?という予測の元選びました。
# 目的変数の分布を確認

# 色分け=SaleCondition
sns.histplot(data=df, x="SalePrice", hue="SaleCondition",bins=20,stat="percent",multiple="stack",palette=sns.color_palette(n_colors=6))

# 色分け=MSSubClass
sns.histplot(data=df, x="SalePrice", hue="MSSubClass",bins=20,stat="percent",multiple="stack",palette=sns.color_palette(n_colors=15))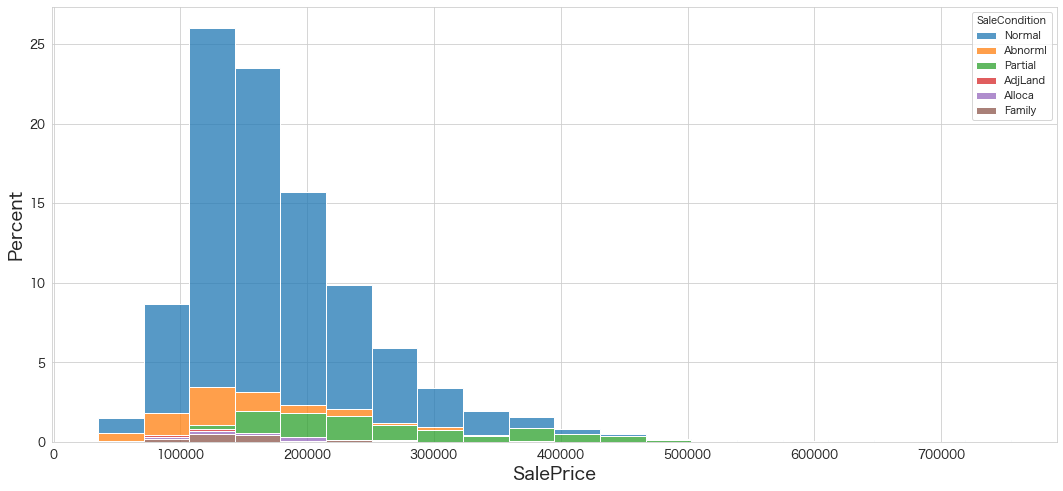
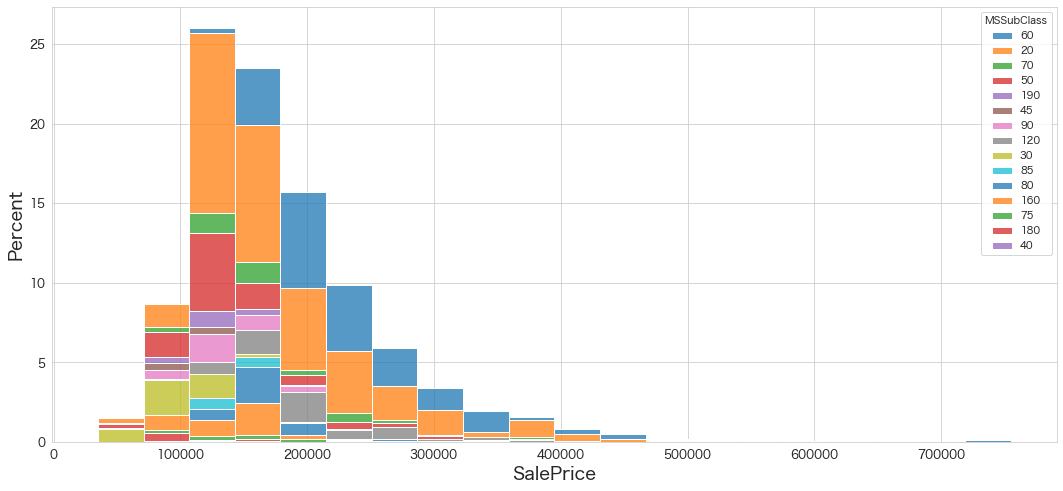
SalePrice=Partialは低い金額にはならないのかな?とかMSSubClass=30(1-STORY 1945 & OLDER)は低い金額になるんだなとか何となく見えてきます。
分布自体も飛び抜けて大きい値はありますが、だいたい100000~200000のレンジが中央値かなとかが分かります。(describeメソッドの50パーセンタイルではSalePriceの中央値は163000ドルであることが確認できます。)
数値型変数の中身をヒストグラムで確認
# 分布確認
fig = plt.figure(figsize=(18,50))

for index in range(len(numerical_df.columns)):
    plt.subplot(10,4,index+1)
    sns.histplot(data=numerical_df.iloc[:,index].dropna(),bins=20)
fig.tight_layout(pad=1.0)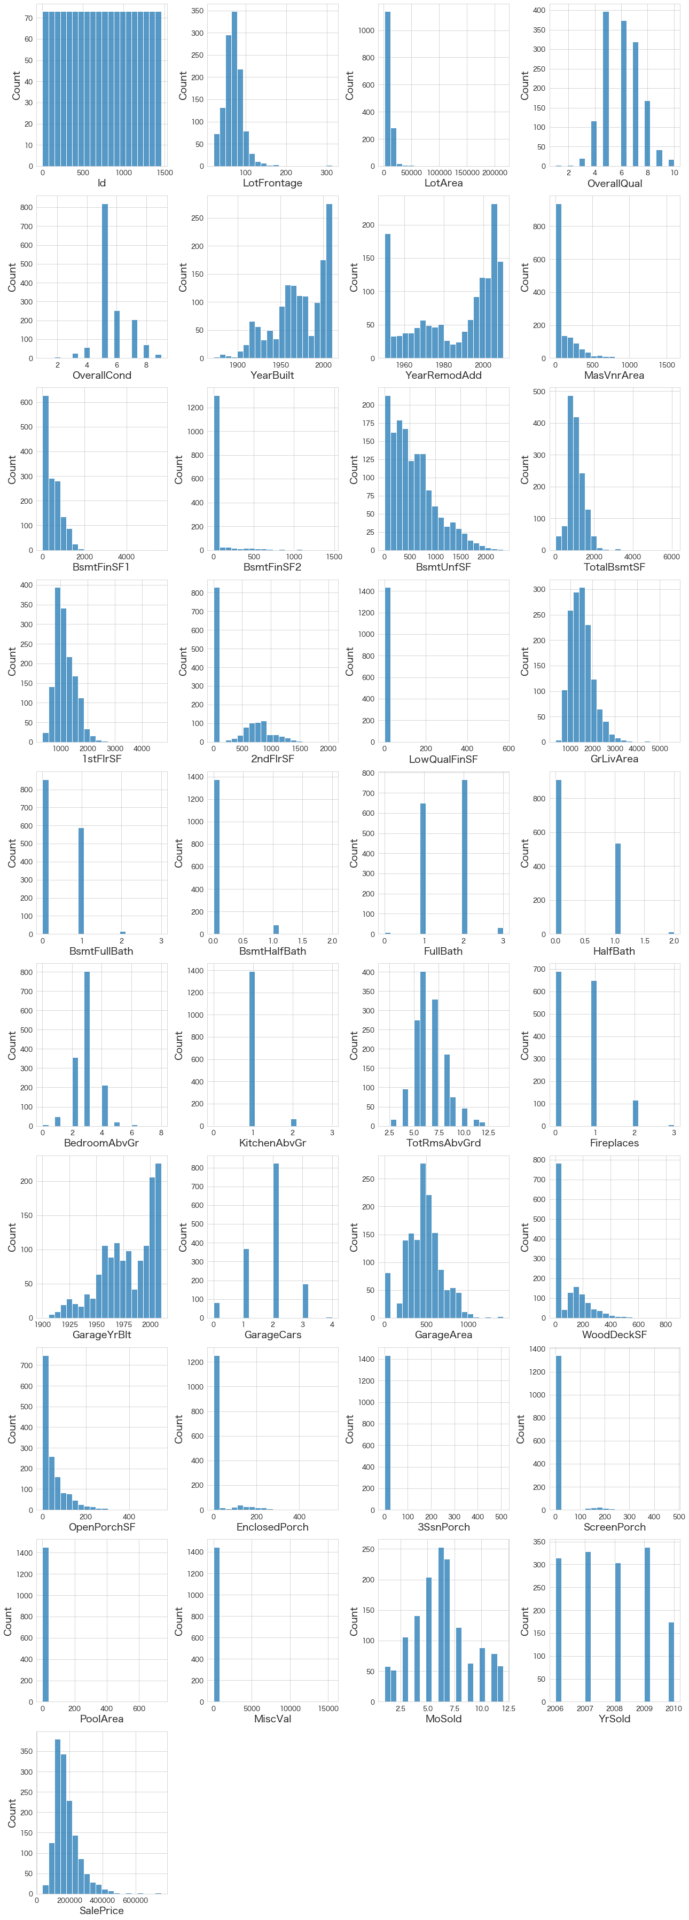
subplotでまとめて見れるので楽です。大量データでやるとどうなるのかは気になります。
名義型変数の中身を区分値ごとのカウントで確認
# 分布確認
fig = plt.figure(figsize=(18,50))

for index in range(len(obj_df.columns)):
    plt.subplot(11,4,index+1)
    data=obj_df.iloc[:,index]
    sns.countplot(x=data)
    plt.xticks(rotation=90)
fig.tight_layout(pad=1.0)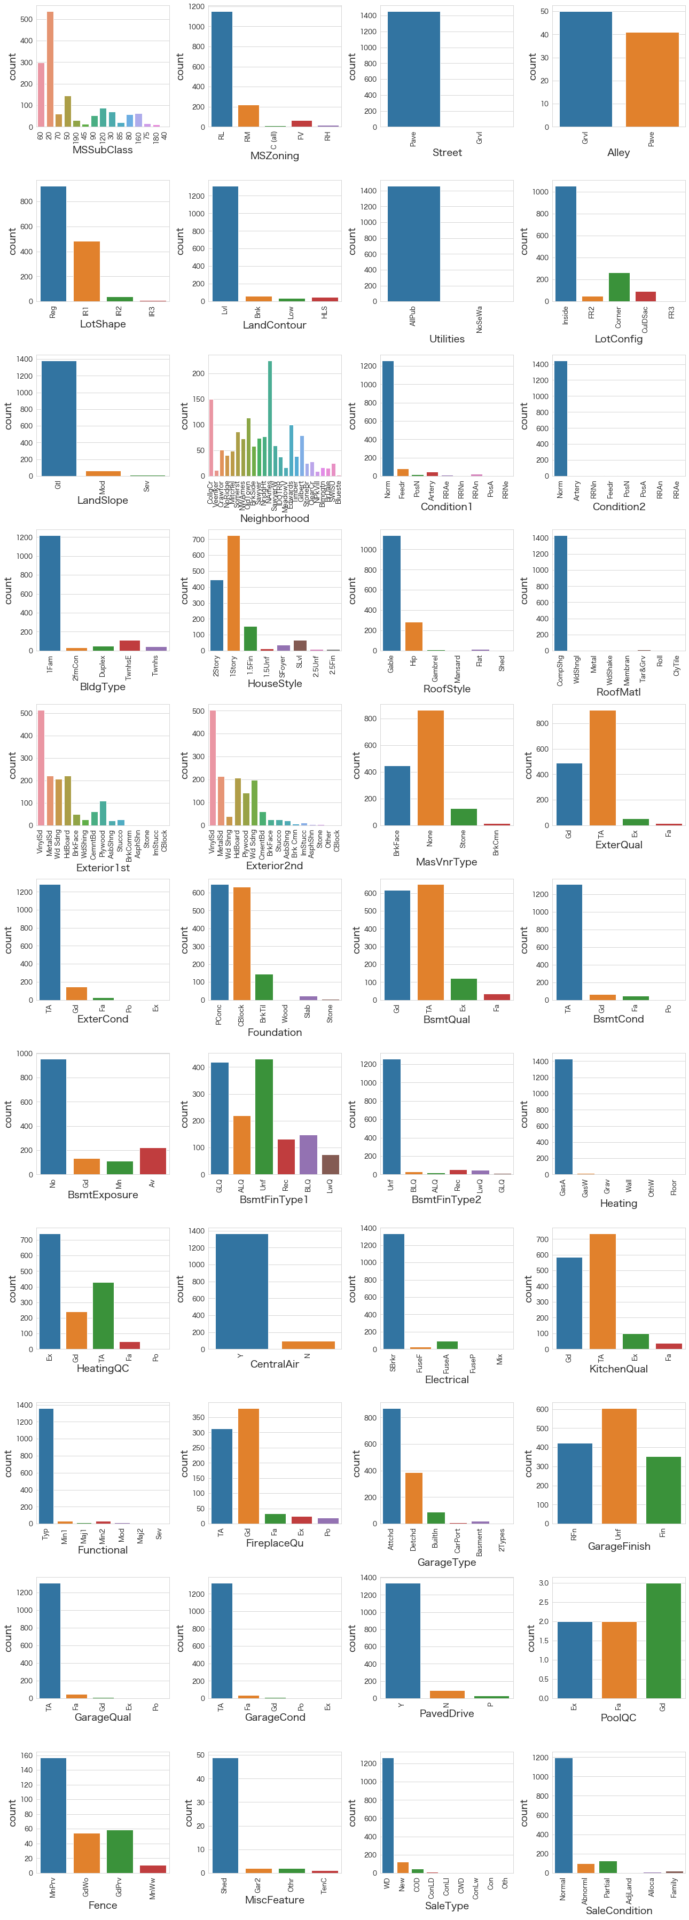
UtilitiesやHeatingなどの分布など確認して見てください。ほとんどが同じ値で占められていることが視覚的に理解出来ます。
まとめ
ざっくりデータの中身を基礎俯瞰してみました。
次回は予測モデルを作成するにあたり、相関係数や目的変数と他の変数の関係性を深掘りしていこうと考えています。
参照
・https://www.kaggle.com/code/ashvanths/complete-eda-and-feature-engineering
・https://inria.github.io/scikit-learn-mooc/python_scripts/datasets_ames_housing.html
