以前、物体検知の精度を確認するのにYOLOv8のvalモードで物体検知した結果の精度を確認してみるという記事を書きました。
YOLOv8のvalモードで101点補完APが簡単に出せるのでいいなと思っていたのですが、物体が1つだけ存在し検知も出来ている場合にAPの結果が0.995になりました。
例えば下記のような画像を検証した場合になります。
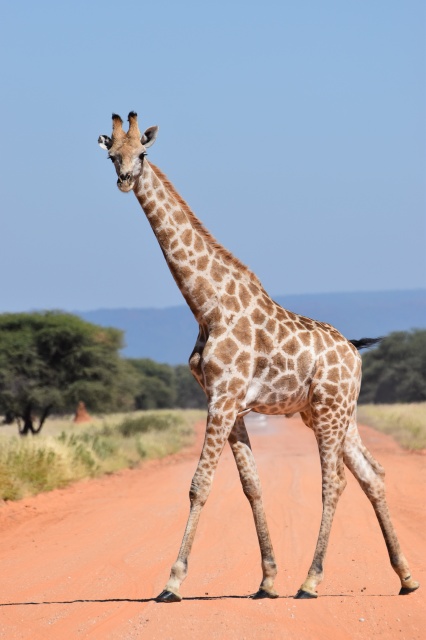
期待値としてはPrecisionが1でRecallが1になるので、PR曲線下の面積はAP=1になるのかと思ったのですが、YOLOv8では少し低い値になるのでなぜだろうという考察になります。
まずはキリン1頭の画像でのvalモード実行結果の確認
from ultralytics import YOLO
from PIL import Image
import cv2
import matplotlib.pyplot as plt
import os

# 事前学習済みのモデルを読み込み(detectionモデルを使用)
model = YOLO('yolov8l.pt')

# 画像の読み込み
img = cv2.imread("/Users/hinomaruc/Desktop/blog/dataset/aidetection_test/valeria-hutter-0FdCO4C_R8M-unsplash.jpg")

# predictモードを実行
results = model.predict(source=img,
                        project="/Users/hinomaruc/Desktop/blog/dataset/yolov8/runs", # 出力先
                        name="test", #フォルダ名
                        exist_ok=True,
                        classes=[23], #キリン
                        show_conf=True,
                        show_labels=True,
                        line_width=1,
                        conf=0.25, # default=0.25
                        iou=0.7, # default=0.7
                        half=False, # default=False
                        save=True)

# valモードを実行
# https://github.com/ultralytics/ultralytics/issues/2151
metrics = model.val(
    data="/Users/hinomaruc/Desktop/blog/dataset/aidetection_test/test.yaml",
    split='val', #testデータセットを使う。デフォルトはsplit='val'
    conf=0.001, #default=0.001
    iou=0.6, # default=0.6
    project="/Users/hinomaruc/Desktop/blog/dataset/yolov8/runs",
    name="test_val",
    exist_ok=True,
    half=True, # default=True
    save_json=True
)
Results saved to /Users/hinomaruc/Desktop/blog/dataset/yolov8/runs/test
Ultralytics YOLOv8.0.98 🚀 Python-3.7.16 torch-1.13.1 CPU
val: Scanning /Users/hinomaruc/Desktop/blog/dataset/aidetection_test... 1 images
val: New cache created: /Users/hinomaruc/Desktop/blog/dataset/aidetection_test.cache
                 Class     Images  Instances      Box(P          R      mAP50  m
                   all          1          1          1          1      0.995      0.995
               giraffe          1          1          1          1      0.995      0.995
Speed: 4.9ms preprocess, 5705.1ms inference, 0.0ms loss, 2.5ms postprocess per image
Saving /Users/hinomaruc/Desktop/blog/dataset/yolov8/runs/test_val/predictions.json...
Results saved to /Users/hinomaruc/Desktop/blog/dataset/yolov8/runs/test_val
比較していて気づきましたが、predictモードとvalモードではconfやiouのデフォルトの値が異なるようです。
valモードのconfが0.001なのは極力正解ラベルの物体を検出できるようにするためでしょうか。
ちなみにvalモードのconfを0.99にすると何も検知されないので、0になってしまいます。confやiouのパラメータは目的に合わせて調整した方が良さそうですね。
Class Images Instances Box(P R mAP50 m
all 1 1 0 0 0 0
import pandas as pd
df = pd.read_json('/Users/hinomaruc/Desktop/blog/dataset/yolov8/runs/test_val/predictions.json')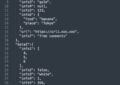
dfimage_id category_id bbox score 0 valeria-hutter-0FdCO4C_R8M-unsplash 23 [96.778, 110.71, 321.297, 494.3] 0.97389 1 valeria-hutter-0FdCO4C_R8M-unsplash 0 [71.849, 400.233, 21.257, 23.689] 0.03471 2 valeria-hutter-0FdCO4C_R8M-unsplash 10 [71.635, 400.182, 21.664, 23.714] 0.00221
valモードでは「23:キリン」の他にも、「0:人」と「10:消火栓」が検知されたようです。
confを0.001にしているからなのですが、正解データに人や消火栓クラスが存在しないので誤検知していてもAP計算に影響はないようです。(誤検知に関しては混合行列とか確認した方がいいのかも)
(オプション) キリンじゃない物体をキリンと誤検知している場合どうなるのか
正解データをいじって検証してみます。「23:キリン」から「0:人」に変更しました。これで人をキリンと誤検知したという状況を作ってみます。
正解データは「23 0.602113 0.557813 0.762911 0.778125」で、先頭の23を0に変更します。
結果はAP=0になりました。
 Class     Images  Instances      Box(P          R      mAP50  m
all          1          1          0          0          0          0
正解データとしてラベルしたものを何も検知できなかったという意味ですね。
(オプション) キリンなのに人と誤検知している場合どうなるのか
正解データに「23 0.188967 0.641406 0.049296 0.039062」の情報を追加してみます。人と検知した位置をキリンのデータとして置換えます。
結果はAP=0.75になりました。キリンと検知したのは1頭のみで正解だったためPrecisionは1で、2匹いるはずのキリンが1匹しか検知できなかったのでRecallが0.5になったということですね。
 Class     Images  Instances      Box(P          R      mAP50  m
   all          1          2          1        0.5       0.75       0.75
giraffe          1          2          1        0.5       0.75       0.75
パターンや挙動が何となく分かってきました。
(オプション) 検知できていないキリンがいる場合どうなるのか
画像の右上の位置にあたる「23 0.908451 0.065625 0.136150 0.103125」を正解データに追加してみます。つまり2頭のキリンがいるのに1頭は未検知だったパターンです。
まぁ状況は1つ前に確かめた、人と誤検知したパターンと同じになるようですね。未検出でも誤検知でも結果は同じになるようです。
 Class     Images  Instances      Box(P          R      mAP50  m
   all          1          2          1        0.5       0.75       0.75
giraffe          1          2          1        0.5       0.75       0.75
正解データをどれくらい補足できているのかということが重要そうですね。
YOLOv8でAPの計算をしている箇所を見てみました
utils/metrics.pyにAPを計算している箇所があります。
def compute_ap(recall, precision):
    """
    Compute the average precision (AP) given the recall and precision curves.
    """

    # Append sentinel values to beginning and end
    mrec = np.concatenate(([0.0], recall, [1.0]))
    mpre = np.concatenate(([1.0], precision, [0.0]))

    # Compute the precision envelope
    mpre = np.flip(np.maximum.accumulate(np.flip(mpre)))

    # Integrate area under curve
    method = 'interp'  # methods: 'continuous', 'interp'
    if method == 'interp':
        x = np.linspace(0, 1, 101)  # 101-point interp (COCO)
        ap = np.trapz(np.interp(x, mrec, mpre), x)  # integrate
    else:  # 'continuous'
        i = np.where(mrec[1:] != mrec[:-1])[0]  # points where x-axis (recall) changes
        ap = np.sum((mrec[i + 1] - mrec[i]) * mpre[i + 1])  # area under curve

    return ap, mpre, mrec

引用: https://github.com/ultralytics/ultralytics/blob/6ee3a9a74bd4318d95890050fcb6cbe276acc698/ultralytics/yolo/utils/metrics.py#LL405C1-L435C26
よく見るとrecallとprecisionの前後にSentinel valuesを追加している実装になっています。PR曲線が左上(0,1)から始まり、右下(1,0)で終わるようになっています。
なので実際はrecall=[0.0,1.0,1.0]、precision=[1.0,1.0,0.0]というリストが計算に利用されます。このように足りない数値を補うことをextrapolation(外挿)と呼ぶようです。
なぜ(0,1)と(1,0)を足しているのか調べてみたところ、#4563にてDetectron2とMMDetectionのAP算出に合わせた実装にしたようです。(YOLOv5のチケットですが、compute_apの実装は同じだったのでYOLOv8に継承しているようです)
このSentinel valuesですが、metrics.pyのHistoryを確認すると下記のように変わってきていたようです。試行錯誤の歴史が垣間見えます。
Oct 25, 2020より前
mrec = np.concatenate(([0.], recall, [recall[-1] + 1E-3]))
mpre = np.concatenate(([0.], precision, [0.]))Oct 25, 2020 #1206
mrec = recall # np.concatenate(([0.], recall, [recall[-1] + 1E-3]))
mpre = precision # np.concatenate(([0.], precision, [0.]))Dec 9, 2020 #1645
mrec = np.concatenate(([0.], recall, [recall[-1] + 0.01]))
mpre = np.concatenate(([1.], precision, [0.]))Aug 27, 2021 #4563
mrec = np.concatenate(([0.0], recall, [1.0]))
mpre = np.concatenate(([1.0], precision, [0.0]))
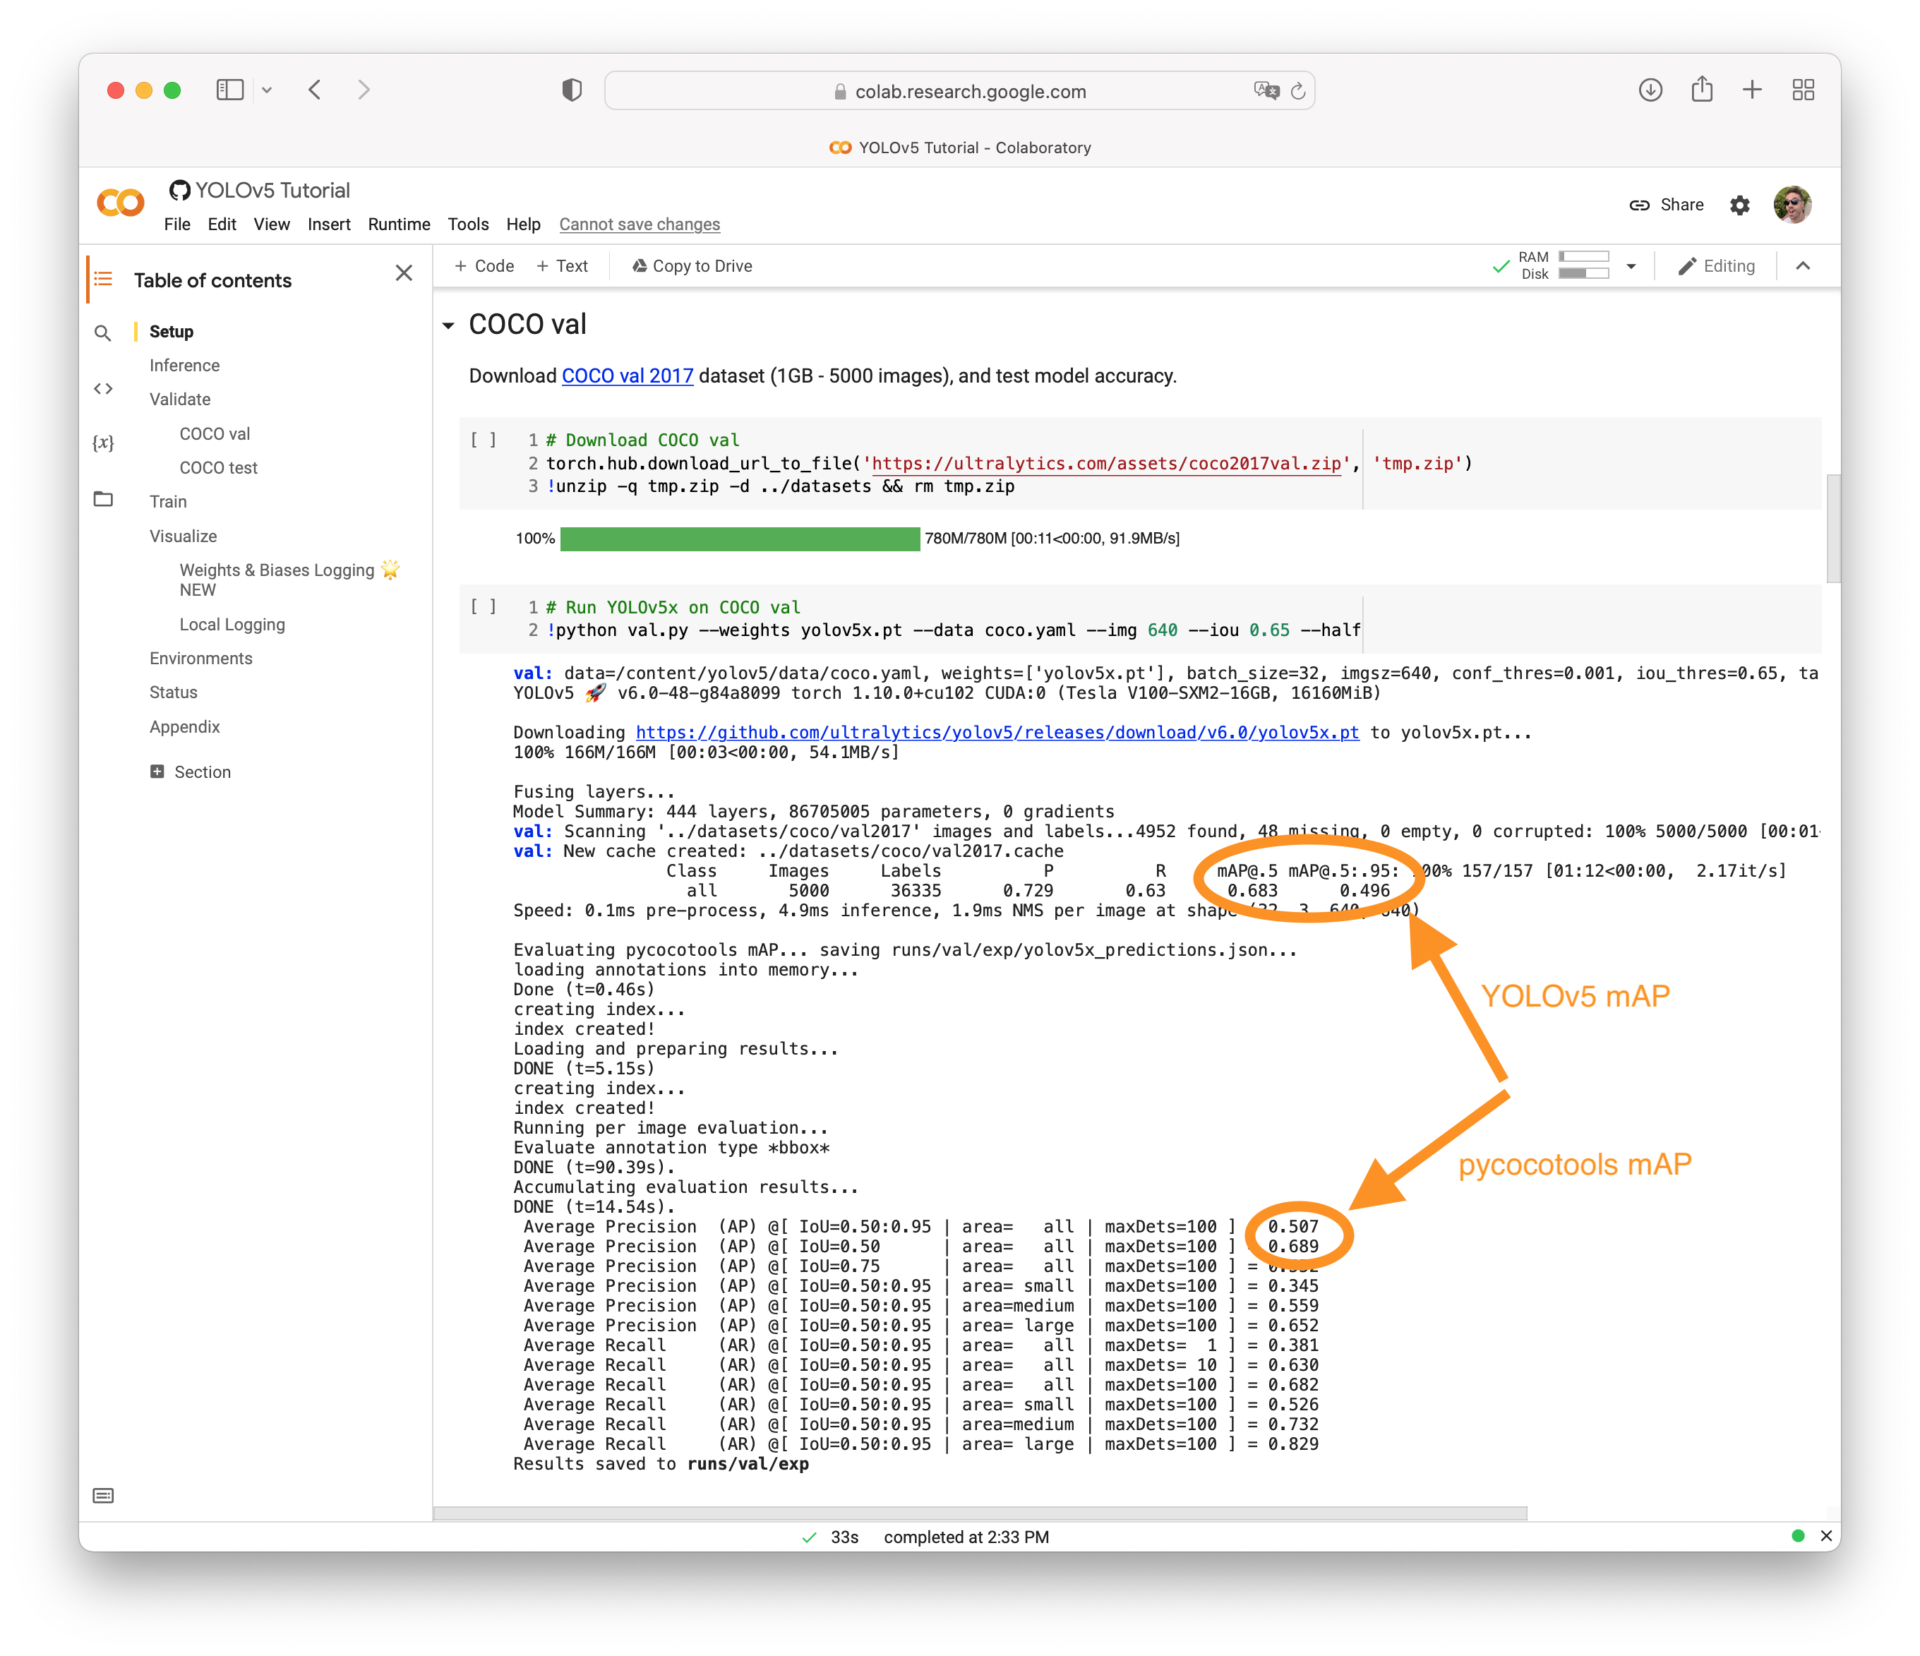
UltralyticsのvalモードのAP計算結果とpycocotoolsのAP計算結果はズレる?
そもそもですが、YOLOv5/v8のvalモードは同じ101点補完APでも、pycocotoolsのmAPの結果とは1%ほどズレがあるようです。(#1622や#5116で詳しくディスカッションされているようです)
pycocotools will typically report mAPs about 1% higher than ours, for both mAP@0.5 and mAP@0.5-0.95
引用: https://github.com/ultralytics/yolov5/issues/1622
pycocotoolsの出力は遅いので独自にYOLOv5/v8では独自にmAPの計算を実装しているようですが、処理速度も保ちつつpycocotoolsと同等のmAPを出来ないかというコンペを過去に開催していたようです。(難題なのか今でもチケットはOpen状態。。) #2258:Competition: pycocotools mAP Alignment
YOLOv5のチケットを確認する限り、YOLOv5ではYOLOv5のmAPとpycocotoolsのmAP両方が出力可能なようですが、YOLOv8だとpycocotoolsのmAPの出力はまだ未実装のようです。(いつになるのか名言できないがYOLOv8でもpycocotoolsのmAPをYOLOv8でも実装予定であるとコメントがチケットにありました。)
#2496:When will yolov8 support COCO data evaluation using pycocotools
チケット上のやりとりやコンペが開催されていることを考慮するとpycocotoolsの結果を正とすべきでしょうか。
カスタムデータセットでpycocotoolsのevalを使う方法はcocoapiの#418チケットにありました。いつかやってみたいと思います。
compute_apメソッドのPR曲線をグラフで描画
APの結果が0.995になるのはなぜか原因を特定するため視覚化してみました。
import numpy as np
import matplotlib.pyplot as plt

def compute_ap(recall, precision):
    """
    Compute the average precision (AP) given the recall and precision curves.
    """

    # Append sentinel values to beginning and end
    mrec = np.concatenate(([0.0], recall, [1.0]))
    mpre = np.concatenate(([1.0], precision, [0.0]))

    # Compute the precision envelope
    mpre = np.flip(np.maximum.accumulate(np.flip(mpre)))

    # Integrate area under curve
    method = 'interp'  # methods: 'continuous', 'interp'
    if method == 'interp':
        x = np.linspace(0, 1, 101)  # 101-point interp (COCO)
        y = np.interp(x, mrec, mpre)
        print(y)
        ap = np.trapz(y, x)  # integrate
        plt.plot(x, y)
        plt.xlabel('Recall')
        plt.ylabel('Precision')
        plt.title('Integrated Curve')
        plt.xlim([0.0, 1.0])
        plt.ylim([0.0, 1.05])
        plt.grid(True)
        plt.show()
    else:  # 'continuous'
        i = np.where(mrec[1:] != mrec[:-1])[0]  # points where x-axis (recall) changes
        ap = np.sum((mrec[i + 1] - mrec[i]) * mpre[i + 1])  # area under curve

    return ap, mpre, mrec

compute_ap([1.0],[1.0])[1. 1. 1. 1. 1. 1. 1. 1. 1. 1. 1. 1. 1. 1. 1. 1. 1. 1. 1. 1. 1. 1. 1. 1. 1. 1. 1. 1. 1. 1. 1. 1. 1. 1. 1. 1. 1. 1. 1. 1. 1. 1. 1. 1. 1. 1. 1. 1. 1. 1. 1. 1. 1. 1. 1. 1. 1. 1. 1. 1. 1. 1. 1. 1. 1. 1. 1. 1. 1. 1. 1. 1. 1. 1. 1. 1. 1. 1. 1. 1. 1. 1. 1. 1. 1. 1. 1. 1. 1. 1. 1. 1. 1. 1. 1. 1. 1. 1. 1. 1. 0.]
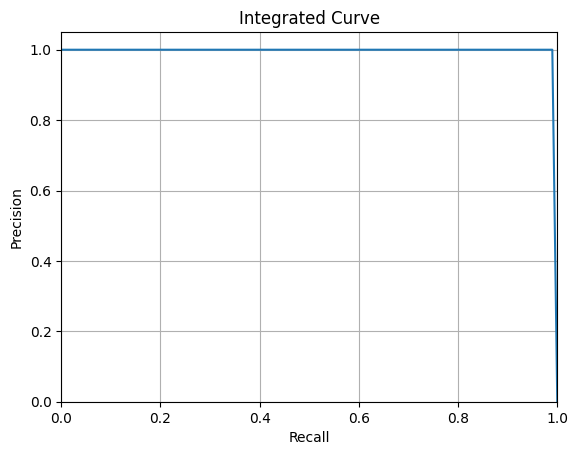
101点目のPrecisionの値が0になっていますね。そのためグラフが最後だけドロップしています。
これがAP=1ではなく、0.995になっている原因と推測します。
まぁ同じメソッドとテストデータを使えば複数のモデル間の精度は比較できるでしょうし、厳密な精度を求めたいという理由がない限り問題はないのかも知れません。
AP計算ツールであるreview_object_detection_metricsを使って精度検証してみる
Object-Detection-Metricsを知っている人も多いのではないでしょうか?物体検知の精度を検証してくれるツールです。#5116によるとUltralyticsのmetrics.pyにもソースとして記載があったようですね。
残念ながらObject-Detection-Metricsは11点補完APとAll Points APの算出のみでcocoの101点補完APには対応していませんでした。
11-point interpolation
Interpolating all points
引用: https://github.com/rafaelpadilla/Object-Detection-Metrics
ですが、新バージョンである「review_object_detection_metrics」では101点補完APの算出に対応してくれています (その他COCO指標も含む)。
ただCUIでの実行はサポートしておらず、GUIのみで実行可能なようです。
実行するときはデスクトップ環境の必要があります。(参考: #82)
The new version includes all COCO metrics, supports other file formats, provides a User Interface (UI) to guide the evaluation process, and presents the STT-AP metric to evaluate object detection in videos.
引用: https://github.com/rafaelpadilla/Object-Detection-Metrics#attention-a-new-version-of-this-tool-is-available-hereAP@.5 and AP@.75
These two metrics evaluate the precision x curve differently than the PASCAL VOC metrics. In this method, the interpolation is performed in N=101 recall points. Then, the computed results for each class are summed up and divided by the number of classes.
The only difference between AP@.5 and AP@.75 is the applied IOU thresholds. AP@.5 uses t=0.5 whereas AP@.75 applies t=0.75. These metrics are commonly used to report detectAPS, APM and APLions performed in the COCO dataset.
引用: https://github.com/rafaelpadilla/review_object_detection_metrics#ap5-and-ap75
またこのツールもpycocotoolsの結果とはズレるようですが原因は#98で詳しく説明されています。
少なくともreview_object_detection_metricsはbboxを想定した精度を出力するようなので、segmentationでの精度を確認したい場合は他の方法を検討する必要があるかも知れません。
In our tool, as we evaluate bounding boxes, we compute the area of the bounding boxes. We don't care about segmentation.
引用: https://github.com/rafaelpadilla/review_object_detection_metrics/issues/98
review_object_detection_metricsのインストール
さっそく、review_object_detection_metricsを使ってみます。
git clone https://github.com/rafaelpadilla/review_object_detection_metrics.gitCloning into 'review_object_detection_metrics'... remote: Enumerating objects: 2312, done. remote: Counting objects: 100% (367/367), done. remote: Compressing objects: 100% (65/65), done. remote: Total 2312 (delta 322), reused 310 (delta 302), pack-reused 1945 Receiving objects: 100% (2312/2312), 38.12 MiB | 8.41 MiB/s, done. Resolving deltas: 100% (1102/1102), done. Updating files: 100% (1010/1010), done.
cd review_object_detection_metrics
source ~/miniforge3/bin/activate
conda update conda
conda env create -n object_detection_metrics --file environment.yml
conda activate object_detection_metrics
python setup.py installdone # # To activate this environment, use # # $ conda activate object_detection_metrics # # To deactivate an active environment, use # # $ conda deactivate
conda activate object_detection_metrics
python3 run.py
review_object_detection_metricsを実行し精度を確認する
最初に載せていたキリン1頭の画像が検知できたとしてAPを計算してみました。
私の環境(Macbook pro 2012)だと実行するとreview_object_detection_metricsの画面がすべてモニター内に収まらず実行ボタンが押せないという現象が発生しました。
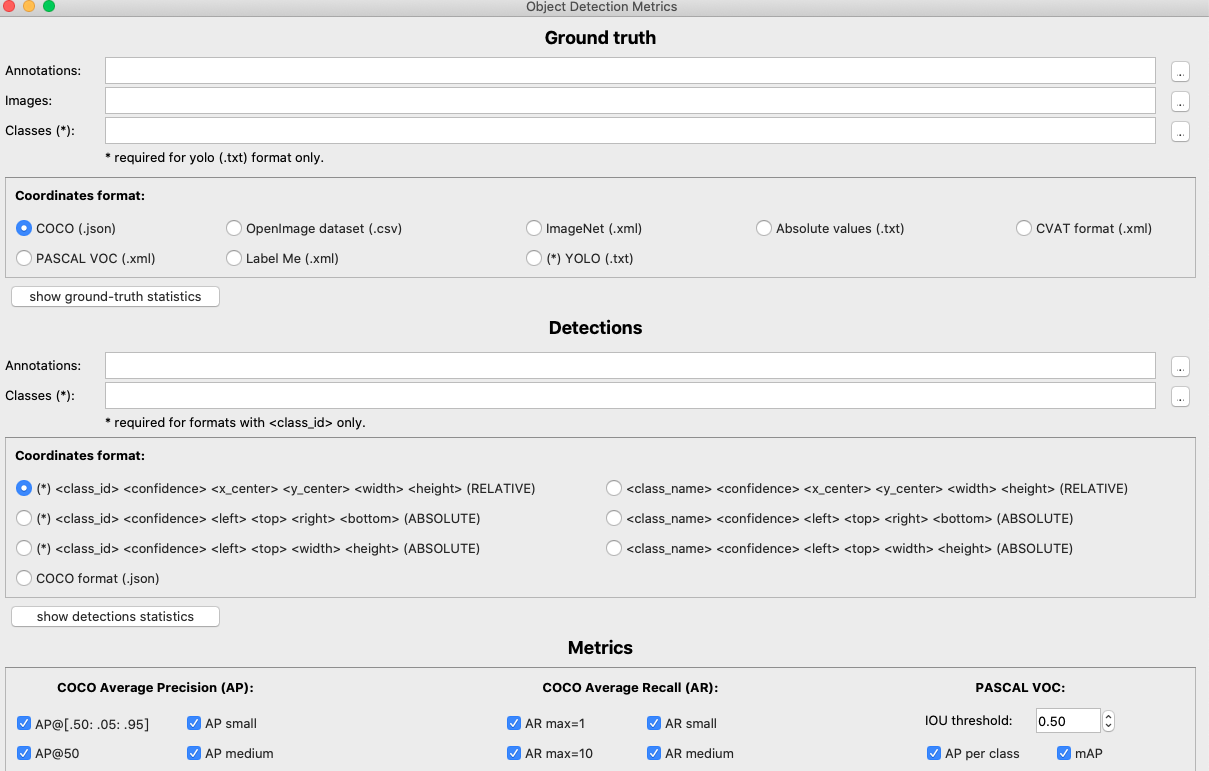
色々試してみたところ、review_object_detection_metrics/src/ui/main_ui.uiというファイルをクリックするとDesignerツールが立ち上がるので実行ボタンが見えるようにレイアウトを変更しました。ちなみにレイアウト変更してuiファイルを上書き保存した後は、Pythonコードを出力する必要がありました。(pyuic5 main_ui.ui -o main_ui.py 参考:convert-pyqt-ui-to-python)
何とか全機能が見れるようになりました。
※ main_ui_tab.uiというデザインも同じ階層にあったので、こちらに変更可能であればレイアウトを変更する必要はなさそうでしたがスピード優先でmain_ui.uiを変更することにしました 笑
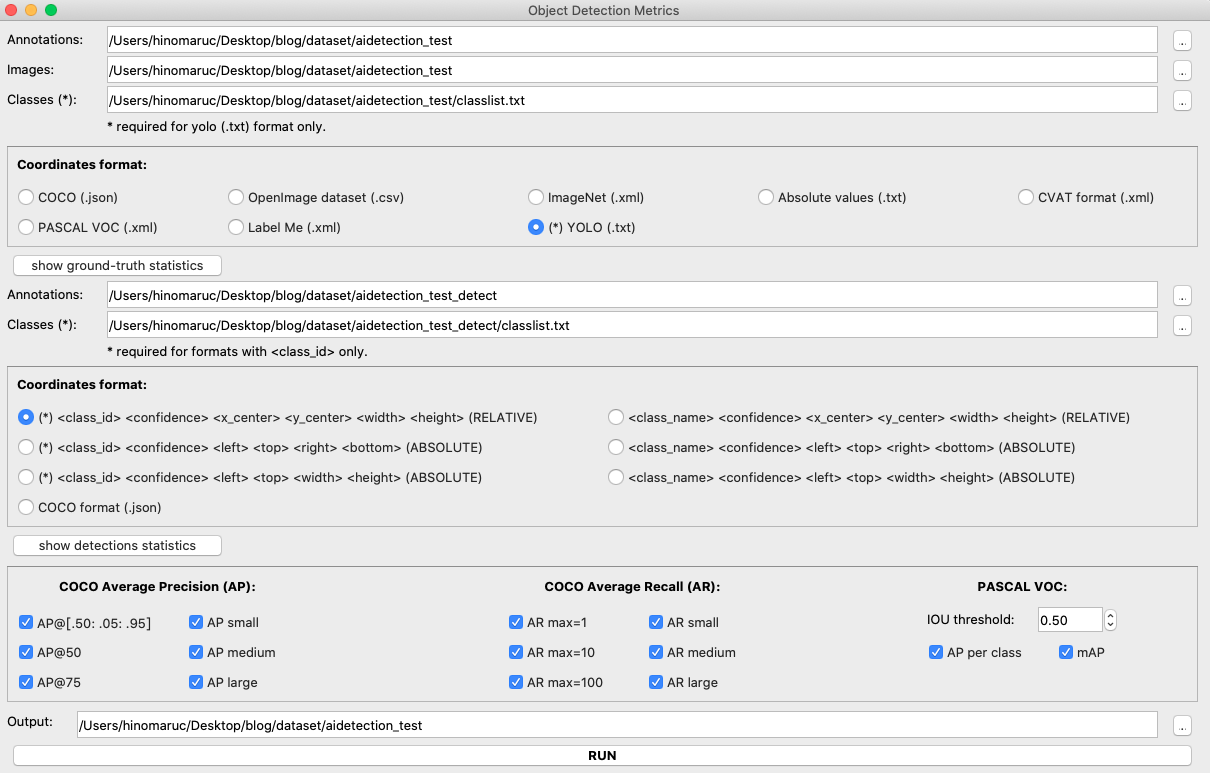
必要なディレクトリやファイルを選択後、RUNボタンを実行すると精度が出てきます。
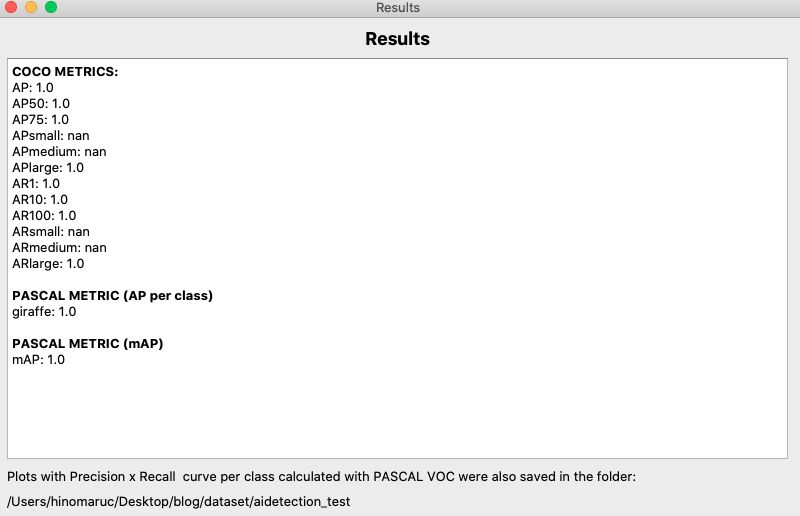
review_object_detection_metricsだとAPは1.0のようですね。(0.995ではないようです)
TorchMetricsを使ってAPを算出する
TorchMetricsというライブラリもCOCO Metricsに沿った精度を算出することが出来るようです。
下記記事にて試しています。

まとめ
YOLOv8のvalモードのAPの結果は低くでる場合があるようでした。
ただ作成した複数のモデルの中で一番良い精度のものを選ぶときなどは、同じデータセットと正解データを使っていればAPの大小でモデルの良し悪しは分かるので気にしなくても良いのかも知れません。
pycocotoolsの結果と合致させたい時やより正確なAPの値を出したいときは注意が必要かも知れませんね。