本記事ではGoogle ColaboratoryのGPU環境でAutoMLライブラリであるAutoGluonをインストールし、Times Series Forecastingの機能が動作するところまでを確認していきます。
AutoGluonのサイトにTime Series Forecastingというセクションがあるので確認しながら進めていきます。
simple forecasting models (e.g., ARIMA, ETS),
powerful neural network-based models (e.g., DeepAR, Transformer, MQ-CNN),
and fit greedy weighted ensembles built on these
AutoGluonの公式サイトの説明によると、簡単な時系列予測モデル(ARIMAモデル、ETSモデルなど)、ニューラルネットワーク系のモデル、重み付けアンサンブルを自動的に構築してくれるようです。便利ですね。
ETSモデルは初耳でしたので調べていたら、Amazon Forecast アルゴリズムのページに各モデルの説明がありました。Amazon ForecastもAutoGluonと同じように自動的に時系列予測モデルを構築してくれるようです。無料枠でも十分モデルを構築できそうなのでいつか試してみたいですね。
AutoGluonの時系列予測用のサブモジュール(Autogluon-Forecasting)はGPUでの学習をサポートしているようなので、使えるようにしたいと思います。CUDAとGPUバージョンのMXNetライブラリ(MXNet-cuxxx)をインストールしておけば自動的にGPUを使って学習してくれるようになるようです。(ただし、複数のGPUでの学習は未対応)
Most of the models used by AutoGluon-Forecasting support GPU training, but it is not required that you train on a GPU. Make sure you have installed CUDA and the GPU version of MXNet. Multi-GPU training is not yet supported.
引用: https://auto.gluon.ai/stable/tutorials/timeseries/forecasting-faq.html#can-i-use-gpus-for-model-training
AutoGluonをインストールするにあたり、事前にColabでGPU環境の動作確認をした記事を書いていますので、本記事の追加情報としてご確認ください。

GPU環境の情報を確認
# CUDAのバージョンの確認
!nvcc --versionnvcc: NVIDIA (R) Cuda compiler driver Copyright (c) 2005-2020 NVIDIA Corporation Built on Mon_Oct_12_20:09:46_PDT_2020 Cuda compilation tools, release 11.1, V11.1.105 Build cuda_11.1.TC455_06.29190527_0
cudaのバージョンは11.1のようです。
# インストール済みのcudaのバージョンを確認
!ls -la /usr/local/ | grep cudalrwxrwxrwx 1 root root 22 Aug 3 20:13 cuda -> /etc/alternatives/cuda drwxr-xr-x 16 root root 4096 Aug 3 19:56 cuda-10.0 drwxr-xr-x 15 root root 4096 Aug 3 19:59 cuda-10.1 lrwxrwxrwx 1 root root 25 Aug 3 20:13 cuda-11 -> /etc/alternatives/cuda-11 drwxr-xr-x 15 root root 4096 Aug 3 20:02 cuda-11.0 drwxr-xr-x 1 root root 4096 Aug 3 20:12 cuda-11.1
CUDA10.0、10.1、11.0、11.1がインストール済みで利用可能のようです。
# GPU関連の情報を表示
!nvidia-smiMon Aug 15 11:08:04 2022 +-----------------------------------------------------------------------------+ | NVIDIA-SMI 460.32.03 Driver Version: 460.32.03 CUDA Version: 11.2 | |-------------------------------+----------------------+----------------------+ | GPU Name Persistence-M| Bus-Id Disp.A | Volatile Uncorr. ECC | | Fan Temp Perf Pwr:Usage/Cap| Memory-Usage | GPU-Util Compute M. | | | | MIG M. | |===============================+======================+======================| | 0 Tesla T4 Off | 00000000:00:04.0 Off | 0 | | N/A 51C P8 10W / 70W | 0MiB / 15109MiB | 0% Default | | | | N/A | +-------------------------------+----------------------+----------------------+ +-----------------------------------------------------------------------------+ | Processes: | | GPU GI CI PID Type Process name GPU Memory | | ID ID Usage | |=============================================================================| | No running processes found | +-----------------------------------------------------------------------------+
Driver Version: 460.32.03、GPUはTesla T4が割当られているようです。
AutoGluonのインストール
https://auto.gluon.ai/stable/install.html を参考にインストールしていきます。
ちなみに今回はLinux、PIP、GPUでのインストール手順を選択しています。
# torchがインストールしてあるかどうか確認
!pip freeze | grep torchtorch @ https://download.pytorch.org/whl/cu113/torch-1.12.1%2Bcu113-cp37-cp37m-linux_x86_64.whl torchaudio @ https://download.pytorch.org/whl/cu113/torchaudio-0.12.1%2Bcu113-cp37-cp37m-linux_x86_64.whl torchsummary==1.5.1 torchtext==0.13.1 torchvision @ https://download.pytorch.org/whl/cu113/torchvision-0.13.1%2Bcu113-cp37-cp37m-linux_x86_64.whl
たまたまかも知れませんが、22年8月現在ColabではAutoGluonの使用でダウンロードすべきcu113のtorchがインストールされているようです。ただし、torchのバージョンが1.12.1のようです。(公式サイトでは、1.21.0-cu113をインストールするようになっている。)
# mxnetがインストールしてあるかどうか確認
!pip freeze | grep mxnet
mxnetはインストールされていませんでした。
CUDA10.1はインストール済みだったので、mxnetライブラリはmxnet-cu101のバージョンをインストールすれば問題なさそうです。
torchもAutoGluonの公式サイトではtorch-1.12.0+cu113をインストールするようになっていましたが、マイナーバージョンが少し異なるだけなのでこのままAutoGluonのインストール作業を進めていきます。
# mxnet-cu101のインストール
!python3 -m pip install "mxnet_cu101<2.0.0, >=1.7.0"
Looking in indexes: https://pypi.org/simple, https://us-python.pkg.dev/colab-wheels/public/simple/
Collecting mxnet_cu101<2.0.0,>=1.7.0
  Downloading mxnet_cu101-1.9.1-py3-none-manylinux2014_x86_64.whl (360.0 MB)
     |████████████████████████████████| 360.0 MB 19 kB/s
・・・省略・・・
Successfully installed graphviz-0.8.4 mxnet-cu101-1.9.1
mxnet_cu101-1.9.1がインストールされました。
# ColabでインストールされているgymがAutoGluonインストール時にincompatible*1になるので、削除
# (*1 gym 0.17.3 requires cloudpickle<1.7.0,>=1.2.0)
!pip uninstall gym -y

# autogluonのインストール (22年8月現在の最新版)
!pip install autogluon==0.5.2
WARNING: The following packages were previously imported in this runtime:
[PIL,contextvars,psutil,pydevd_plugins,urllib3,yaml]
You must restart the runtime in order to use newly installed versions.
上記のようなWARNINGが出る場合は、WARNINGの下部に表示される「RESTART RUNTIME」ボタンを押してランタイムを再起動します。
Found existing installation: gym 0.17.3
Uninstalling gym-0.17.3:
  Successfully uninstalled gym-0.17.3
Looking in indexes: https://pypi.org/simple, https://us-python.pkg.dev/colab-wheels/public/simple/
Collecting autogluon==0.5.2
  Downloading autogluon-0.5.2-py3-none-any.whl (9.6 kB)
・・・省略・・・
Successfully installed Pillow-9.0.1 antlr4-python3-runtime-4.8 autocfg-0.0.8 autogluon-0.5.2 autogluon-contrib-nlp-0.0.1b20220208 autogluon.common-0.5.2 autogluon.core-0.5.2 autogluon.features-0.5.2 autogluon.multimodal-0.5.2 autogluon.tabular-0.5.2 autogluon.text-0.5.2 autogluon.timeseries-0.5.2 autogluon.vision-0.5.2 boto3-1.24.52 botocore-1.27.52 catboost-1.0.6 cloudpickle-2.1.0 colorama-0.4.5 contextvars-2.4 dask-2021.11.2 deprecated-1.2.13 distlib-0.3.5 distributed-2021.11.2 fairscale-0.4.6 flake8-3.9.2 fsspec-2022.7.1 gluoncv-0.10.5.post0 gluonts-0.9.8 grpcio-1.43.0 huggingface-hub-0.8.1 hyperopt-0.2.7 immutables-0.18 jmespath-1.0.1 lightgbm-3.3.2 locket-1.0.0 mccabe-0.6.1 nlpaug-1.1.10 nptyping-1.4.4 omegaconf-2.1.2 partd-1.3.0 platformdirs-2.5.2 pmdarima-1.8.5 portalocker-2.5.1 psutil-5.8.0 py4j-0.10.9.7 pyDeprecate-0.3.2 pycodestyle-2.7.0 pyflakes-2.3.1 pytorch-lightning-1.6.5 pytorch-metric-learning-1.3.2 pyyaml-6.0 ray-1.13.0 s3transfer-0.6.0 sacrebleu-2.2.0 sacremoses-0.0.53 scikit-image-0.19.3 sentencepiece-0.1.95 sktime-0.11.4 statsmodels-0.13.2 tbats-1.1.0 tensorboardX-2.5.1 timm-0.5.4 tokenizers-0.12.1 torchmetrics-0.7.3 transformers-4.20.1 typish-1.9.3 urllib3-1.25.11 virtualenv-20.16.3 xgboost-1.4.2 yacs-0.1.8
# autogluonがインストールされているか確認
!pip freeze | grep autogluonautogluon==0.5.2 autogluon-contrib-nlp==0.0.1b20220208 autogluon.common==0.5.2 autogluon.core==0.5.2 autogluon.features==0.5.2 autogluon.multimodal==0.5.2 autogluon.tabular==0.5.2 autogluon.text==0.5.2 autogluon.timeseries==0.5.2 autogluon.vision==0.5.2
念のため確認。RUNTIMEを再起動してもインストールされたままでした、よかった。
AutoGluonで時系列予測のquickstartをやってみる
AutoGluonのquickstartで使用されているデータはKaggleの国・地域ごとのCOVID-19の累積の陽性者数を日毎にまとめたコンペのもののようです。
データはKaggleのCOVID19 Global Forecasting (Week 4)
ページでも確認できました。
他の分析者が同じデータを使って予測モデルを作成した結果も掲載されていたりするのでとても勉強になりそうです。
・COVID Global Forecast: SIR model + ML regressions
・Timeseries Forecasting of Covid-19 ARIMA
※ Kaggleだと死者数もデータ上存在していますが、AutoGluonのquickstart用に用意されているデータは陽性者数のみ含まれているようです。
AutoGluon timeseriesライブラリのインポート
# とりあえず、quickstartをやってみる
# https://auto.gluon.ai/stable/tutorials/timeseries/forecasting-quickstart.html
import pandas as pd
from matplotlib import pyplot as plt
from autogluon.timeseries import TimeSeriesPredictor, TimeSeriesDataFrame
df = pd.read_csv("https://autogluon.s3-us-west-2.amazonaws.com/datasets/CovidTimeSeries/train.csv" , parse_dates=["Date"])df.info()RangeIndex: 22536 entries, 0 to 22535 Data columns (total 3 columns): # Column Non-Null Count Dtype --- ------ -------------- ----- 0 Date 22536 non-null datetime64[ns] 1 ConfirmedCases 22536 non-null float64 2 name 22536 non-null object dtypes: datetime64[ns](1), float64(1), object(1) memory usage: 528.3+ KB
df.head()
Date ConfirmedCases name 0 2020-01-22 0.0 Afghanistan_ 1 2020-01-23 0.0 Afghanistan_ 2 2020-01-24 0.0 Afghanistan_ 3 2020-01-25 0.0 Afghanistan_ 4 2020-01-26 0.0 Afghanistan_
# どんな国・地域のデータがあるか確認
from IPython.display import HTML
HTML(pd.DataFrame(df["name"].drop_duplicates()).to_html())
      name


      0
      Afghanistan_


      72
      Albania_


      144
      Algeria_


      216
      Andorra_


      288
      Angola_


      ・・・
      ・・・


      10656
      Japan_


      ・・・
      ・・・

      22176
      Vietnam_


      22248
      West Bank and Gaza_


      22320
      Western Sahara_


      22392
      Zambia_


      22464
      Zimbabwe_
日本のデータもありました。
10656 Japan_
pandasのデータフレームをTimeSeriesDataFrame型に変換
# https://auto.gluon.ai/stable/api/autogluon.predictor.html#timeseriesdataframe
# データフレームをTimeSeriesDataFrame型に変換
train_data = TimeSeriesDataFrame.from_data_frame(df,id_column="name",timestamp_column="Date")
# 日本、中国、台湾、韓国のデータを見てみる
plt.figure(figsize=(20, 3))
plt.plot(train_data.loc["Japan_"], label="Japan_")
plt.plot(train_data.loc["China_Beijing"], label="China_Beijing")
plt.plot(train_data.loc["China_Hong Kong"], label="China_Hong Kong")
plt.plot(train_data.loc["China_Shanghai"], label="China_Shanghai")
plt.plot(train_data.loc["Taiwan*_"], label="Taiwan*_")
plt.plot(train_data.loc["Korea, South_"], label="Korea, South_")
plt.legend()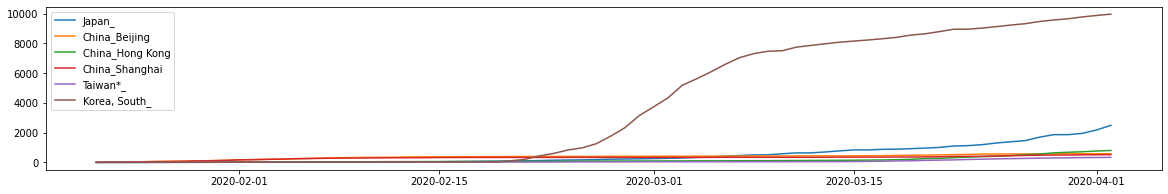
韓国の陽性者数が多かった時期のようです。(テレビで見た記憶だと、PCR検査を積極的にやっていると放映されていましたのでその影響でしょうか)
日本も中国や台湾に比べると増加傾向のようです。確か当時ゴールデンウィークや夏休み期間中に陽性者数が増えてましたね。
# 日本のデータを確認
train_data.loc["Japan_"]
ConfirmedCases timestamp 2020-01-22 2.0 2020-01-23 2.0 2020-01-24 2.0 2020-01-25 2.0 2020-01-26 4.0 ... ... 2020-03-29 1866.0 2020-03-30 1866.0 2020-03-31 1953.0 2020-04-01 2178.0 2020-04-02 2495.0 72 rows × 1 columns
TimeSeriesDataFrame型に変換されたようです。
学習用データとテスト用データを分ける
# 予測期間 (今回のケースだと5日間)
prediction_length = 5

# メソッドの中身ではdeep copyになっている
test_data = train_data.copy()

# 2020-03-29 ~ 2020-04-02をテスト用、それ以外を学習用データにする
train_data = train_data.slice_by_timestep(slice(None, -prediction_length))
# もう一度日本のデータを確認
train_data.loc["Japan_"]
ConfirmedCases timestamp 2020-01-22 2.0 2020-01-23 2.0 2020-01-24 2.0 2020-01-25 2.0 2020-01-26 4.0 ... ... 2020-03-24 1193.0 2020-03-25 1307.0 2020-03-26 1387.0 2020-03-27 1468.0 2020-03-28 1693.0 67 rows × 1 columns
2020-03-29 ~ 2020-04-02を学習データから除外出来ました。学習データから除くことによってテストデータとして活用します。
plt.figure(figsize=(20, 3))

plt.plot(test_data.loc["Japan_"], label="test")
plt.plot(train_data.loc["Japan_"], label="train")

# テスト期間を強調する
plt.fill_betweenx(
    y=(0, test_data.loc["Japan_"]["ConfirmedCases"].max()),
    x1=test_data.loc["Japan_"].index.max(),
    x2=train_data.loc["Japan_"].index.max(),
    alpha=0.1,
    label="test interval",
)

plt.legend()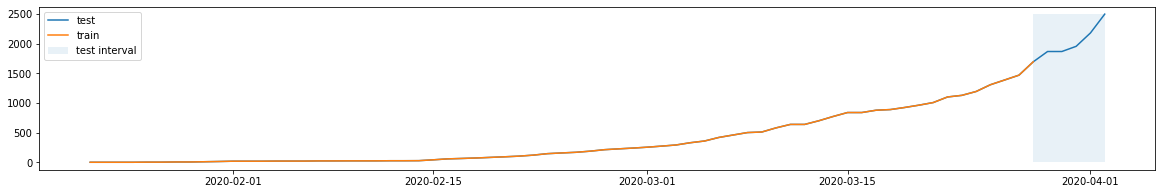
青い部分が予測期間です。(2020-03-29 ~ 2020-04-02)
AutoGluon timeseriesで学習を実施
# https://auto.gluon.ai/stable/api/autogluon.predictor.html#module-5
predictor = TimeSeriesPredictor(
    path="autogluon-covidforecast",
    target="ConfirmedCases", # 目的変数
    prediction_length=prediction_length,
    eval_metric="MAPE"
)

predictor.fit(train_data=train_data,presets="medium_quality")
INFO:autogluon.timeseries.predictor:presets is set to medium_quality
INFO:autogluon.timeseries.predictor:================ TimeSeriesPredictor ================
INFO:autogluon.timeseries.predictor:TimeSeriesPredictor.fit() called
INFO:autogluon.timeseries.predictor:Setting presets to: medium_quality
INFO:autogluon.timeseries.predictor:Fitting with arguments:
INFO:autogluon.timeseries.predictor:{'evaluation_metric': 'MAPE',
 'hyperparameter_tune_kwargs': None,
 'hyperparameters': 'default',
 'prediction_length': 5,
 'target_column': 'ConfirmedCases',
 'time_limit': None}
INFO:autogluon.timeseries.predictor:Provided training data set with 20971 rows, 313 items. Average time series length is 67.0.
INFO:autogluon.timeseries.predictor:Training artifacts will be saved to: /content/autogluon-covidforecast
・・・省略・・・
Early stopping based on learning rate scheduler callback (min_lr was reached).
・・・省略・・・
INFO:autogluon.timeseries.trainer:Training complete. Models trained: ['AutoETS', 'ARIMA', 'SimpleFeedForward', 'DeepAR', 'Transformer', 'WeightedEnsemble']
INFO:autogluon.timeseries.trainer:Total runtime: 1028.19 s
INFO:autogluon.timeseries.trainer:Best model: WeightedEnsemble
INFO:autogluon.timeseries.trainer:Best model score: -0.1909
Early stoppingが効いているようです。
最終的に精度が良かったのはWeightedEnsembleという結果になりました。
AutoGluon timeseriesの学習結果を確認
# リーダーボードを出力します。(今回作成したモデル一覧の出力)
predictor.leaderboard(test_data, silent=True)
model score_test score_val pred_time_test pred_time_val fit_time_marginal fit_order 0 WeightedEnsemble -0.126967 -0.190910 108.279142 72.376842 163.391455 6 1 ARIMA -0.130960 -0.217947 70.466397 40.062617 36.077777 2 2 AutoETS -0.139035 -0.200706 34.848404 28.134276 10.836153 1 3 DeepAR -0.165079 -0.272058 2.679754 2.536010 290.899123 4 4 SimpleFeedForward -0.166112 -0.217958 1.772242 1.780663 159.658630 3 5 Transformer -0.198846 -0.318812 2.380797 2.399286 217.463975 5 # ベストモデルの表示 predictor.get_model_best()Out[0]'WeightedEnsemble'作成したモデルで3/29~4/2の陽性者数を予測
# 時系列予測します。第二引数はNULLでも問題ありません。(NULLでもデフォルトでベストモデルを適用してくれるようです) # Return quantile and mean forecasts given a dataset to predict with. predictions = predictor.predict(train_data,"WeightedEnsemble")# 日本の時系列予測結果を確認 predictions.loc['Japan_']Out[0]
mean 0.1 0.2 0.3 0.4 0.5 0.6 0.7 0.8 0.9 timestamp 2020-03-29 1781.427911 1710.290247 1740.601331 1754.111097 1766.809584 1779.126367 1792.985219 1804.945547 1823.348852 1857.021463 2020-03-30 1881.600359 1789.483109 1824.709147 1842.048556 1860.851993 1875.696261 1892.381883 1908.977281 1935.170724 1971.699085 2020-03-31 1999.277677 1873.820295 1913.036853 1951.669173 1975.836747 1995.951123 2016.270150 2039.741008 2077.563178 2139.759351 2020-04-01 2079.341657 1927.693621 1976.550792 2015.261353 2045.439732 2074.313260 2098.657873 2132.342035 2174.076857 2236.746834 2020-04-02 2161.498898 1908.858956 2059.488293 2094.232740 2134.366014 2171.711377 2202.869270 2242.985256 2291.159177 2377.366471 予測平均値と分位数の値をもつデータのようです。
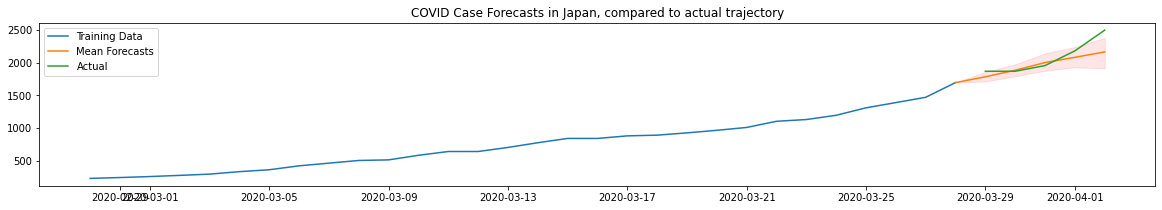
予測結果をグラフにして確認
# 日本の実際の陽性者数と予測した陽性者数の値をグラフにします。 plt.figure(figsize=(20, 3)) # 2020-03-28までの実際の陽性者数 (青い線) ytrue = train_data.loc['Japan_']["ConfirmedCases"] # 時系列予測結果 (2020-03-29 ~ 2020-04-02) ypred = predictions.loc['Japan_'] # ypredに2020-03-28のデータをytueから追加 ypred.loc[ytrue.index[-1]] = [ytrue[-1]] * 10 ypred = ypred.sort_index() # 2020-03-29 ~ 2020-04-02までに実際の陽性者数 (緑の線) ytrue_test = test_data.loc['Japan_']["ConfirmedCases"][-5:] # 折れ線グラフを表示 (青、オレンジ、緑) plt.plot(ytrue[-30:], label="Training Data") plt.plot(ypred["mean"], label="Mean Forecasts") plt.plot(ytrue_test, label="Actual") plt.fill_between(ypred.index, ypred["0.1"], ypred["0.9"], color="red", alpha=0.1) plt.title("COVID Case Forecasts in Japan, compared to actual trajectory") _ = plt.legend()Out[0]
後半は予測された値よりも陽性者数が実際は多かったようです。
まとめ
AutoGluonで時系列予測をすることが出来ました。今回の学習ではmedium_qualityで予測しましたが、good_qualityなどに変更して学習すると時間はさらにかかりますが予測精度があがることが期待できると思います。
predictor.fit(train_data=train_data,presets="medium_quality")