今回はMeta社のProphetというツールを使ってみたいと思います。
Prophet is a forecasting procedure implemented in R and Python. It is fast and provides completely automated forecasts that can be tuned by hand by data scientsts and analysts
引用: https://facebook.github.io/prophet/
Prophetは時系列予測のためデータサイエンティストやアナリストが手動でチューニングするような作業を高速かつ完全自動化してくれるツールのようです。
事前に「venv-prophet」という名前の仮想環境をvenvで作成し、prophet実行用の環境を作成しています。
仮想環境の作成方法は色々記事にまとめているので、venvコマンドでのPython仮想環境作成方法の記事一覧をご確認ください。
それではやっていきたいと思います。
Prophetのインストール
公式のインストール手順に沿ってやりつつ、その他必要なライブラリ(plotlyなど)も必要に応じてインストールしてください。
As of v1.1, the minimum supported Python version is 3.7.
# Prophetのインストール
python3 -m pip install prophet
Collecting prophet
  Downloading prophet-1.1-cp38-cp38-macosx_10_9_x86_64.whl (6.8 MB)
     ━━━━━━━━━━━━━━━━━━━━━━━━━━━━━━━━━━━━━━━━ 6.8/6.8 MB 12.6 MB/s eta 0:00:00
・・・省略・・・
Installing collected packages: setuptools-git, pytz, pymeeus, korean-lunar-calendar, ephem, ujson, tqdm, six, pyparsing, pillow, numpy, kiwisolver, hijri-converter, fonttools, Cython, cycler, convertdate, python-dateutil, packaging, pandas, matplotlib, LunarCalendar, holidays, cmdstanpy, prophet
Successfully installed Cython-0.29.32 LunarCalendar-0.0.9 cmdstanpy-1.0.7 convertdate-2.4.0 cycler-0.11.0 ephem-4.1.3 fonttools-4.37.1 hijri-converter-2.2.4 holidays-0.15 kiwisolver-1.4.4 korean-lunar-calendar-0.2.1 matplotlib-3.5.3 numpy-1.23.2 packaging-21.3 pandas-1.4.3 pillow-9.2.0 prophet-1.1 pymeeus-0.5.11 pyparsing-3.0.9 python-dateutil-2.8.2 pytz-2022.2.1 setuptools-git-1.2 six-1.16.0 tqdm-4.64.0 ujson-5.4.0
# prophetの予測結果の描画に必要。prophetの依存関係ではインストールされない。
python3 -m pip install plotly
Collecting plotly
  Downloading plotly-5.10.0-py2.py3-none-any.whl (15.2 MB)
     ━━━━━━━━━━━━━━━━━━━━━━━━━━━━━━━━━━━━━━━━ 15.2/15.2 MB 1.9 MB/s eta 0:00:00
Collecting tenacity>=6.2.0
  Using cached tenacity-8.0.1-py3-none-any.whl (24 kB)
Installing collected packages: tenacity, plotly
Successfully installed plotly-5.10.0 tenacity-8.0.1
# 仮想環境のカーネルをjupyter notebookで読み込むのに必要
python3 -m pip install ipykernelCollecting ipykernel Using cached ipykernel-6.15.1-py3-none-any.whl (132 kB) ・・・省略・・・ Successfully installed appnope-0.1.3 asttokens-2.0.8 backcall-0.2.0 debugpy-1.6.3 decorator-5.1.1 entrypoints-0.4 executing-0.10.0 ipykernel-6.15.1 ipython-8.4.0 jedi-0.18.1 jupyter-client-7.3.4 jupyter-core-4.11.1 matplotlib-inline-0.1.6 nest-asyncio-1.5.5 parso-0.8.3 pexpect-4.8.0 pickleshare-0.7.5 prompt-toolkit-3.0.30 psutil-5.9.1 ptyprocess-0.7.0 pure-eval-0.2.2 pygments-2.13.0 pyzmq-23.2.1 stack-data-0.4.0 tornado-6.2 traitlets-5.3.0 wcwidth-0.2.5
# prophet.plotで必要
python3 -m pip install ipywidgetsRequirement already satisfied: ipywidgets in ./venv-prophet/lib/python3.8/site-packages (8.0.1) Requirement already satisfied: ipykernel>=4.5.1 in ./venv-prophet/lib/python3.8/site-packages (from ipywidgets) (6.15.1) ・・・省略・・・ Requirement already satisfied: six>=1.5 in ./venv-prophet/lib/python3.8/site-packages (from python-dateutil>=2.8.2->jupyter-client>=6.1.12->ipykernel>=4.5.1->ipywidgets) (1.16.0)
# prophet.plotで必要
python3 -m pip install nbformatCollecting nbformat Using cached nbformat-5.4.0-py3-none-any.whl (73 kB) ・・・省略・・・ Successfully installed attrs-22.1.0 fastjsonschema-2.16.1 importlib-resources-5.9.0 jsonschema-4.14.0 nbformat-5.4.0 pkgutil-resolve-name-1.3.10 pyrsistent-0.18.1 zipp-3.8.1
これでProphetを使う準備は完了しました。
アップル引越しの引越し数をprophetで予想する
データの読み込み
# アップル引越しのデータセットを読み込む
import pandas as pd
from matplotlib import pyplot as plt
df = pd.read_csv("/Users/hinomaruc/Desktop/blog/dataset/applehikkoshi/train.csv" , parse_dates=["ds"], dtype={'y':'float64'}, skiprows=1, header=0, names=['ds','y','client','close','price_am','price_pm'])
df_test = pd.read_csv("/Users/hinomaruc/Desktop/blog/dataset/applehikkoshi/test.csv" , parse_dates=["ds"], dtype={'y':'float64'}, header=0, names=['ds','client','close','price_am','price_pm'])df.info()RangeIndex: 2100 entries, 0 to 2099 Data columns (total 6 columns): # Column Non-Null Count Dtype --- ------ -------------- ----- 0 ds 2100 non-null datetime64[ns] 1 y 2100 non-null float64 2 client 2100 non-null int64 3 close 2100 non-null int64 4 price_am 2100 non-null int64 5 price_pm 2100 non-null int64 dtypes: datetime64[ns](1), float64(1), int64(4) memory usage: 98.6 KB
# 描画設定
from IPython.display import HTML
import seaborn as sns
from matplotlib import ticker
import matplotlib.pyplot as plt
sns.set_style("whitegrid")
from matplotlib import rcParams
rcParams['font.family'] = 'Hiragino Sans' # Macの場合
#rcParams['font.family'] = 'Meiryo' # Windowsの場合
#rcParams['font.family'] = 'VL PGothic' # Linuxの場合
rcParams['xtick.labelsize'] = 12       # x軸のラベルのフォントサイズ
rcParams['ytick.labelsize'] = 12       # y軸のラベルのフォントサイズ
rcParams['axes.labelsize'] = 18        # ラベルのフォントとサイズ
rcParams['figure.figsize'] = 18,8      # 画像サイズの変更(inch)
Prophetのモデル作成
from prophet import Prophet

# Prophetのモデルを「乗法」で作成する
m = Prophet(seasonality_mode='multiplicative')

# 追加情報
m.add_regressor('client')
m.add_regressor('close')
m.add_regressor('price_am')
m.add_regressor('price_pm')

# 休日情報の追加。Prophet(holidays=holidays)みたいに独自の休日も定義できる
m.add_country_holidays(country_name='JP')

# 月次変動の追加
m.add_seasonality(name='monthly', period=30.5, fourier_order=5)
Importing plotly failed. Interactive plots will not work.
と出る場合はplotlyをインストールしてください。pip install plotlyProphet will by default fit weekly and yearly seasonalities, if the time series is more than two cycles long. It will also fit daily seasonality for a sub-daily time series.
引用: https://facebook.github.io/prophet/docs/seasonality,_holiday_effects,_and_regressors.html
seasonality_modeはデフォルトだとadditive(加法)ですが、multiplicative(乗法)に変更しました。
加法と乗法の違いはトレンドに季節変動を足し算するのか掛け算するのかの違いのようです。
下記サンプルも確認しつつ、成長企業であるアップル引っ越しセンターさんのデータだと乗法が適しているかなと思いmultiplicativeを設定しています。

また、経済産業省の資料でも加法モデルと乗法モデルについて記載がありましたので補足情報として参考にさせていただきました。
# 学習する
m.fit(df)20:13:09 - cmdstanpy - INFO - Chain [1] start processing 20:13:10 - cmdstanpy - INFO - Chain [1] done processing
作成した時系列モデルで未来のデータを予測する
# サンプルに倣ってfutureという変数にテストデータを格納
future = df_test
future.tail()
ds client close price_am price_pm 360 2017-03-27 0 0 5 4 361 2017-03-28 0 0 4 4 362 2017-03-29 0 0 3 3 363 2017-03-30 0 0 4 3 364 2017-03-31 1 0 5 4
# 時系列予測の実施
forecast = m.predict(future)
forecast[['ds', 'yhat', 'yhat_lower', 'yhat_upper']].tail()
ds yhat yhat_lower yhat_upper 360 2017-03-27 107.201573 96.743794 118.044199 361 2017-03-28 99.783254 88.477981 110.533612 362 2017-03-29 99.228027 88.347294 110.201684 363 2017-03-30 104.988336 94.441006 116.517109 364 2017-03-31 111.204893 100.114157 122.140570
予測結果の描画
# 予測結果を描画
fig1 = m.plot(forecast)
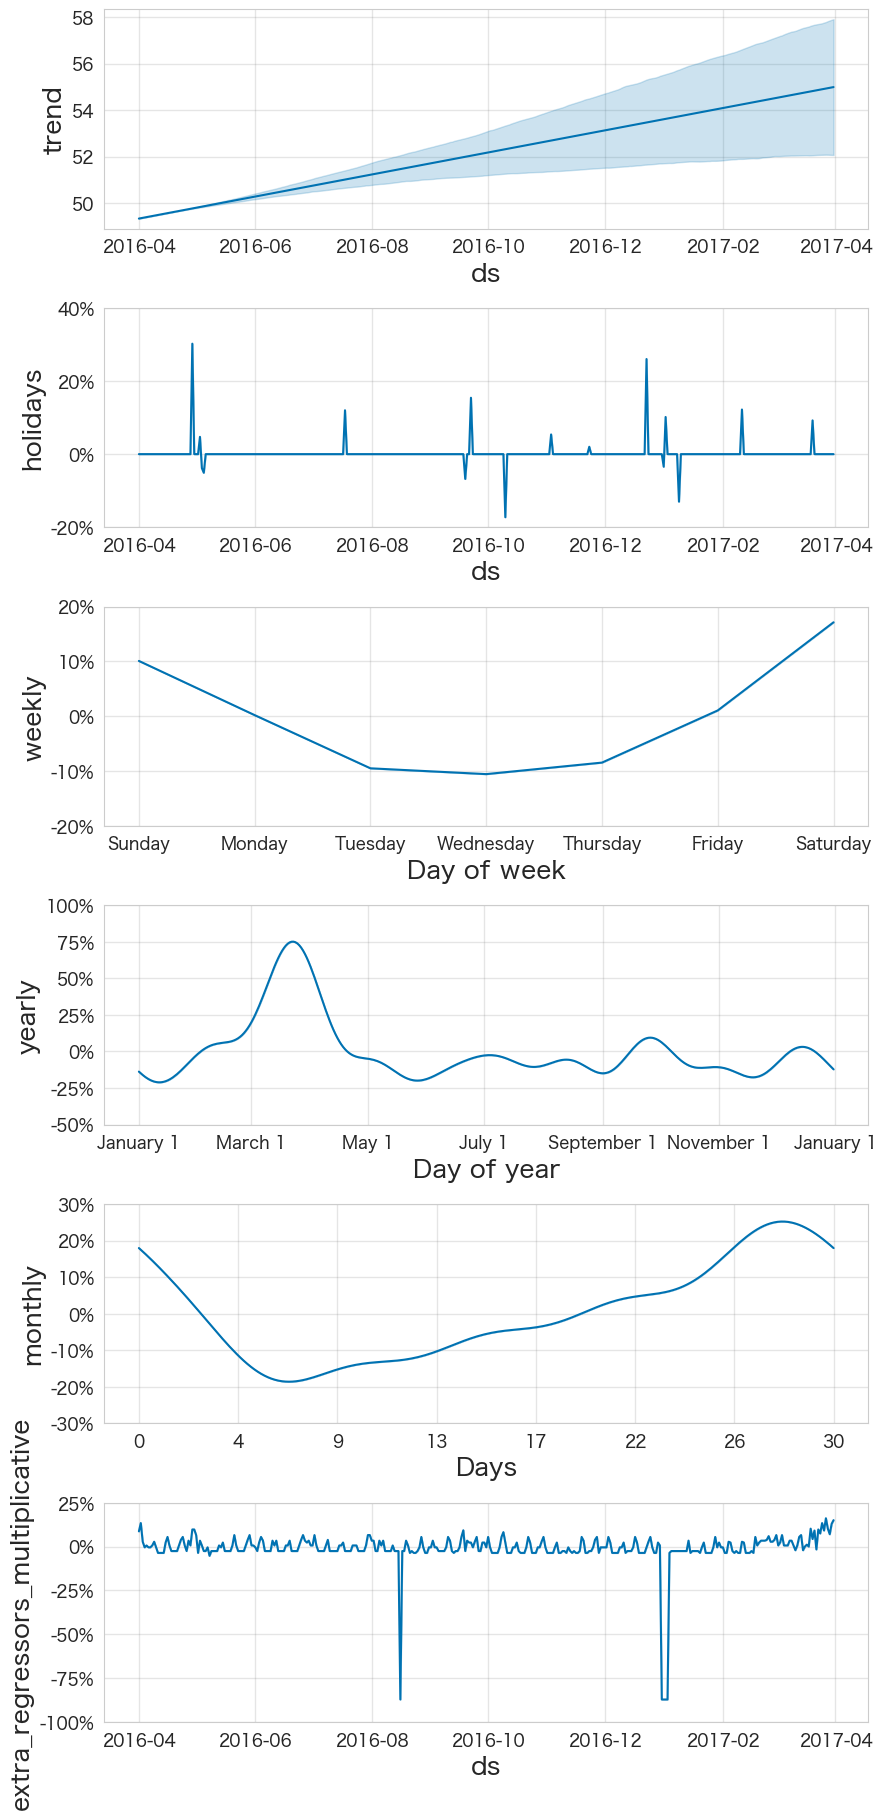
# トレンドや各種変動の描画
fig2 = m.plot_components(forecast)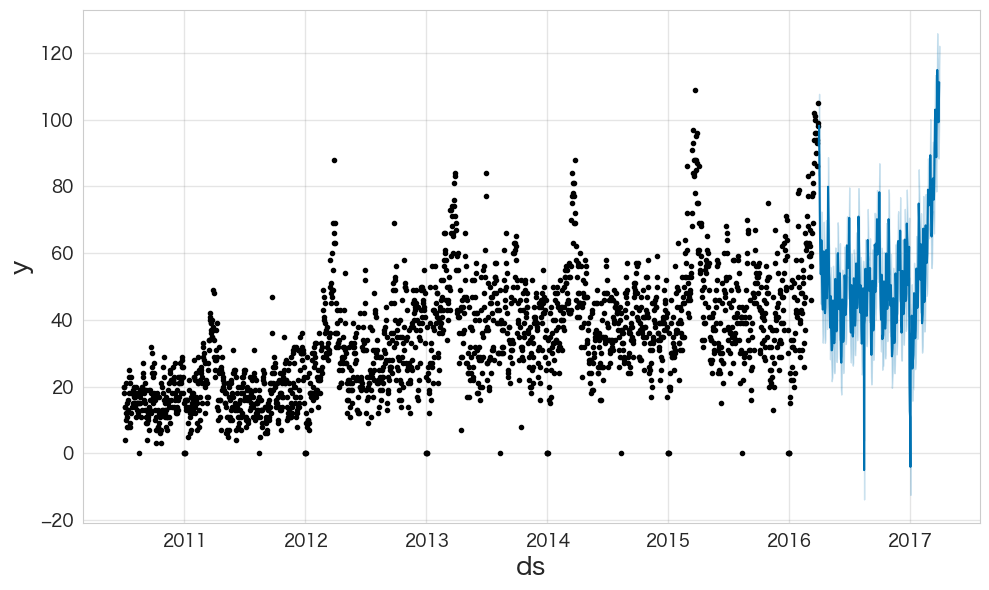
予測結果の確認 (インタラクティブver)
from prophet.plot import plot_plotly, plot_components_plotly
# 年/月/曜日変動の傾向グラフを確認
plot_plotly(m, forecast)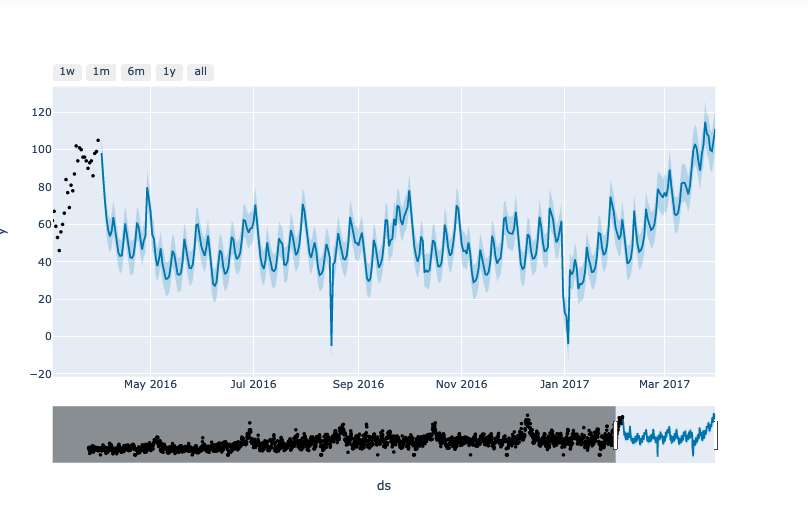
図は予測期間に絞っています。
また描画時に下記エラーがでたので、ipywidgetsとnbformatをインストールすることによって解決しました。
NameError: name 'go' is not defined
→ python3 -m pip install ipywidgets
ValueError: Mime type rendering requires nbformat>=4.2.0 but it is not installed
→ python3 -m pip install nbformat
予測結果の描画 (インタラクティブver)
# トレンドと各変動の描画
plot_components_plotly(m, forecast)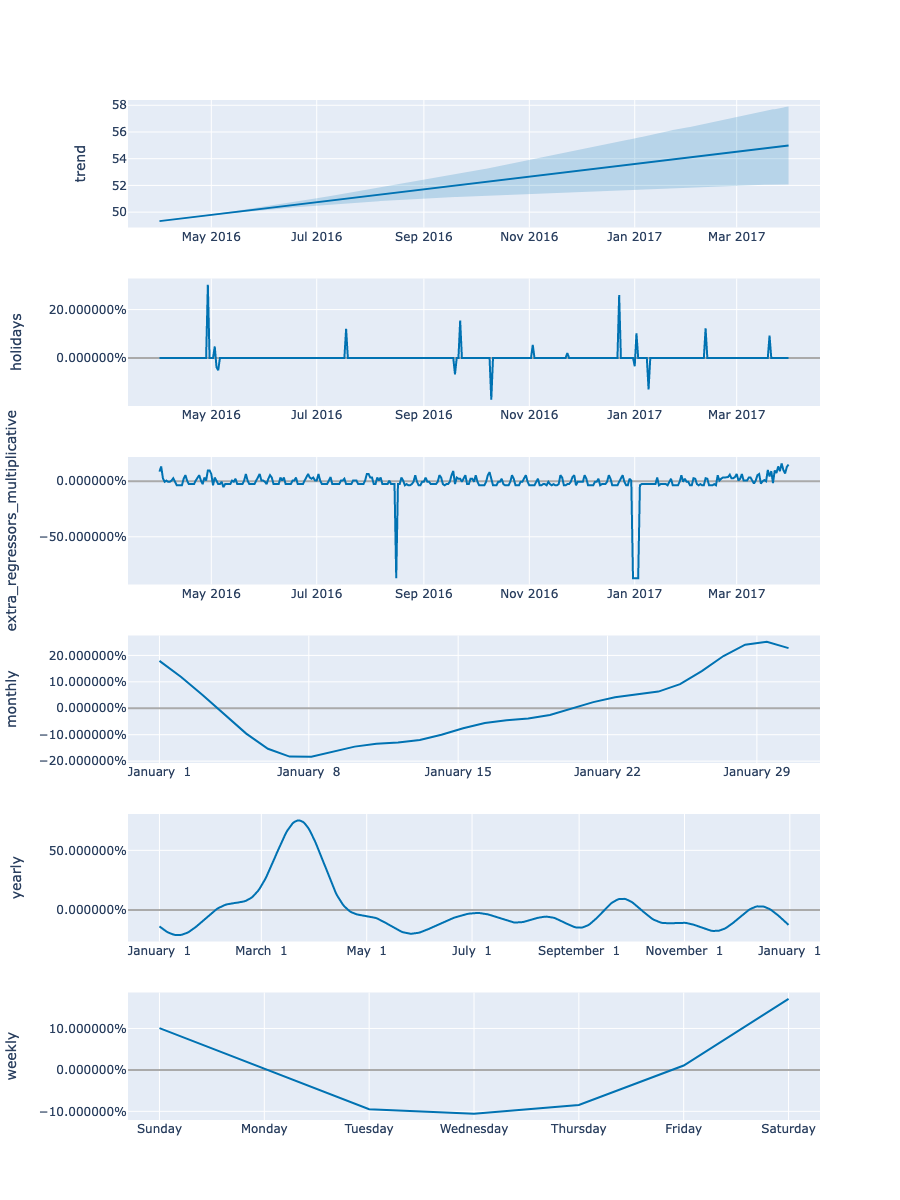
予測ファイルの提出とスコア確認
# 提出用ファイルの作成
forecast[["ds","yhat"]].to_csv("applehikkoshi-submission.csv",index=False, header=False)

# 提出
!signate submit --competition-id=269 applehikkoshi-submission.csv --note "model#2 prophet"You have successfully submitted your predictions.We will send you the submission result to your email address. 評価結果:9.87535666418961
予測データの確認
カラム一覧と基礎統計
# カラムの確認
forecast.columns
Index(['ds', 'trend', 'yhat_lower', 'yhat_upper', 'trend_lower', 'trend_upper',
       'client', 'client_lower', 'client_upper', 'close', 'close_lower',
       'close_upper', 'extra_regressors_multiplicative',
       'extra_regressors_multiplicative_lower',
       'extra_regressors_multiplicative_upper', 'holidays', 'holidays_lower',
       'holidays_upper', 'monthly', 'monthly_lower', 'monthly_upper',
       'multiplicative_terms', 'multiplicative_terms_lower',
       'multiplicative_terms_upper', 'price_am', 'price_am_lower',
       'price_am_upper', 'price_pm', 'price_pm_lower', 'price_pm_upper',
       'weekly', 'weekly_lower', 'weekly_upper', 'yearly', 'yearly_lower',
       'yearly_upper', 'こどもの日', 'こどもの日_lower', 'こどもの日_upper', 'みどりの日',
       'みどりの日_lower', 'みどりの日_upper', '体育の日', '体育の日_lower', '体育の日_upper', '元日',
       '元日_lower', '元日_upper', '勤労感謝の日', '勤労感謝の日_lower', '勤労感謝の日_upper',
       '国民の休日', '国民の休日_lower', '国民の休日_upper', '天皇誕生日', '天皇誕生日_lower',
       '天皇誕生日_upper', '山の日', '山の日_lower', '山の日_upper', '建国記念の日',
       '建国記念の日_lower', '建国記念の日_upper', '憲法記念日', '憲法記念日_lower', '憲法記念日_upper',
       '成人の日', '成人の日_lower', '成人の日_upper', '振替休日', '振替休日_lower', '振替休日_upper',
       '敬老の日', '敬老の日_lower', '敬老の日_upper', '文化の日', '文化の日_lower', '文化の日_upper',
       '春分の日', '春分の日_lower', '春分の日_upper', '昭和の日', '昭和の日_lower', '昭和の日_upper',
       '海の日', '海の日_lower', '海の日_upper', '秋分の日', '秋分の日_lower', '秋分の日_upper',
       'additive_terms', 'additive_terms_lower', 'additive_terms_upper',
       'yhat'],
      dtype='object')
forecast[["trend","holidays","monthly","weekly","yearly","yhat"]].describe()
trend holidays monthly weekly yearly yhat count 365.000000 365.000000 365.000000 365.000000 365.000000 365.000000 mean 52.159618 0.002135 -0.000665 0.000029 -0.000405 51.777636 std 1.641973 0.028295 0.131134 0.097818 0.212428 17.158980 min 49.327307 -0.172648 -0.186164 -0.105531 -0.210888 -5.016806 25% 50.743462 0.000000 -0.122386 -0.094954 -0.118251 41.196013 50% 52.159618 0.000000 -0.021885 0.002066 -0.061845 48.913355 75% 53.575773 0.000000 0.086331 0.100924 0.029828 59.444109 max 54.991929 0.302164 0.250954 0.171396 0.751299 114.905286
yhat(予測値)のminが-5.016とマイナスの値があるようです。引っ越し数は0以上になるはずなのでこれは変ですね。
# 予測値にマイナスが含まれているようなので確認
forecast[["ds","yhat"]].query("yhat < 0")
ds yhat 137 2016-08-16 -5.016806 277 2017-01-03 -4.058824
8月中旬や年始が含まれるので休業日が怪しそうです。
休業日(close)の引っ越し数がどう予測されているか確認
# closeフラグがONの日付を確認
df_test.query("close == 1")
ds client close price_am price_pm 137 2016-08-16 0 1 -1 -1 274 2016-12-31 0 1 -1 -1 275 2017-01-01 0 1 -1 -1 276 2017-01-02 0 1 -1 -1 277 2017-01-03 0 1 -1 -1
# 休業日付近の予測値を確認
forecast[["ds","close","yhat"]].query("(ds >= '2016-08-11' and ds <= '2016-08-18') or (ds >= '2016-12-26' and ds <= '2017-01-07')")
ds close yhat 132 2016-08-11 0.000000 35.572773 133 2016-08-12 0.000000 42.567970 134 2016-08-13 0.000000 49.489882 135 2016-08-14 0.000000 46.474513 136 2016-08-15 0.000000 42.425398 137 2016-08-16 -0.814342 -5.016806 138 2016-08-17 0.000000 38.672652 139 2016-08-18 0.000000 39.947627 269 2016-12-26 0.000000 55.335369 270 2016-12-27 0.000000 50.411994 271 2016-12-28 0.000000 52.144086 272 2016-12-29 0.000000 57.907989 273 2016-12-30 0.000000 61.907542 274 2016-12-31 -0.814342 21.502124 275 2017-01-01 -0.814342 12.663063 276 2017-01-02 -0.814342 10.799801 277 2017-01-03 -0.814342 -4.058824 278 2017-01-04 0.000000 35.780866 279 2017-01-05 0.000000 33.173922 280 2017-01-06 0.000000 34.738972 281 2017-01-07 0.000000 41.281705
[データクリーニング] 休業日は引越し数を0にする。
# 休業日は引越し数を0に代入してあげる
forecast.loc[~(forecast.close == 0.0),["yhat"]] = 0.0
# 代入結果を確認
forecast.loc[~(forecast.close == 0.0)]["yhat"]137 0.0 274 0.0 275 0.0 276 0.0 277 0.0 Name: yhat, dtype: float64
0に置換できたようです。
再度予測ファイルの提出とスコア確認
# もう一度提出用ファイルの作成
forecast[["ds","yhat"]].to_csv("applehikkoshi-submission.csv",index=False, header=False)

# もう一度提出
!signate submit --competition-id=269 applehikkoshi-submission.csv --note "model#2 prophet 休業日対応"You have successfully submitted your predictions.We will send you the submission result to your email address. 評価結果:9.58790656592466
先ほどより精度がよくなりました。